Do allocations aimed at managing volatility beat simple equal weighting as applied to the cheapest third of 32 country stock markets based on 10-year cyclically adjusted price-to-earnings ratio (CAPE, or P/E10). In their October 2012 paper entitled “Global CAPE Model Optimization”, Adam Butler, Michael Philbrick, Rodrigo Gordillo and Mebane Faber compare the following six volatility management strategies to EW for a low-P/E10 equity index portfolio:
- Equal Volatility: each selected index contributes equally to the volatility of a fully invested portfolio.
- Fixed Volatility Limit: allocates to each selected index up to a daily volatility limit of 1%, with any remaining funds going to cash.
- Portfolio Volatility Target: allocates equally to all selected indexes with a portfolio-level annualized volatility target of 10%, going to cash when above target (but not applying leverage when below).
- Risk Parity with Portfolio Volatility Target: a combination of strategies 1 and 3; allocates such that all indexes contribute equally to portfolio volatility with a portfolio-level annualized volatility target of 10%, going to cash when above target (but not applying leverage when below).
- Minimum Variance: minimum variance via a combination of low volatilities and low correlations per Modern Portfolio Theory, but always fully invested.
- Minimum Variance with Portfolio Volatility Target: minimum variance allocations adjusted at the portfolio level to target 10% annualized portfolio volatility, going to cash when above target (but not applying leverage when below).
For all strategies, they estimate prescribed volatilities based on the last 60 days of returns, with monthly portfolio reformation. Using daily and monthly total returns for the 32 country stock indexes during April 1999 through August 2012, they find that:
- Essential benchmarks over the entire sample period with monthly rebalancing are:
- Equally weighting all 32 indexes (EW) generates a gross annualized return of 8.4% and gross annual Sharpe ratio 0.41, with maximum drawdown 58%.
- Equally weighting the third of indexes with the lowest lagged P/E10 (EW P/E10) generates a gross annualized return of 10.8% and gross annual Sharpe ratio 0.44, with maximum drawdown 65%.
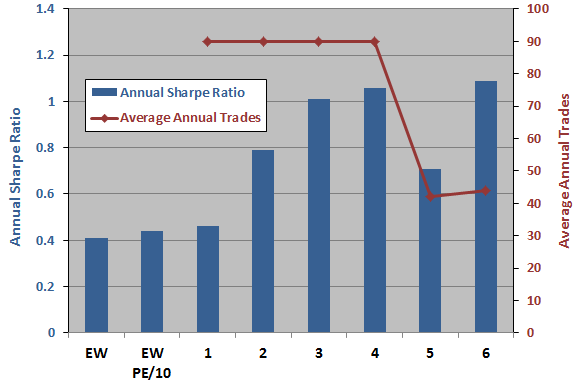
- The six volatility management strategies generally improve gross Sharpe ratio (see the chart below) and reduce maximum drawdown:
- Equal Volatility generates a gross annualized return of 10.9% and gross annual Sharpe ratio 0.46, with maximum drawdown 66%.
- Fixed Volatility Limit generates a gross annualized return of 10.6% and gross annual Sharpe ratio 0.79, with maximum drawdown 39%.
- Portfolio Volatility Target generates a gross annualized return of 11.6% and gross annual Sharpe ratio 1.01, with maximum drawdown 31%.
- Risk Parity with Portfolio Volatility Target generates a gross annualized return of 12.2% and gross annual Sharpe ratio 1.06, with maximum drawdown 31%.
- Minimum Variance generates a gross annualized return of 14.1% and gross annual Sharpe ratio 0.79, with maximum drawdown 60%.
- Minimum Variance with Portfolio Volatility Target generates a gross annualized return of 13.0% and gross annual Sharpe ratio 1.09, with maximum drawdown 32%. Moreover, this strategy is more consistently profitable than, and involves only about half the turnover of, strategies 3 and 4.
The following chart, constructed from data in the paper, summarizes gross annual Sharpe ratios for the two baseline strategies and both gross annual Sharpe ratios and average annual trading frequencies for the six alternative volatility management strategies as listed above. Results indicate that volatility management strategies implemented with monthly portfolio reformation generally enhance gross Sharpe ratio, but entail trading frictions that are likely material to net performance.
Gross enhancement is most pronounced for strategies that set a portfolio-level volatility target (3, 4 and 6) . Strategy 6, Minimum Variance with Portfolio Volatility Target, appears attractive based on high gross Sharpe ratio and relatively low annual turnover.

In summary, evidence indicates that strategies setting portfolio-level volatility targets for a set of global stock indexes easily outperform equal weighting based on gross Sharpe ratio and maximum drawdown.
Cautions regarding findings include:
- The study employs indexes rather than tradable assets, tending to overstate the returns an investor would experience after bearing the trading frictions and management fees associated with index-tracking funds. These costs would likely vary across countries and could be highest for countries with the lowest values of P/E10.
- As noted, reported returns are gross, and trading frictions for volatility management strategies with monthly portfolio reformation appear to be material and significantly different. Net findings may therefore differ from gross findings.
- Testing many strategies on the same sample incorporates data snooping bias, such that best results likely overstate reasonable out-of-sample expectations.
- In historical perspective, the available sample period is a volatile one for equity markets, arguably favoring volatility management strategies. Future sample periods may be less volatile.
- The sample period is extremely short for P/E10 analysis, encompassing only about two independent ten-year earnings measurement intervals. The study essentially addresses volatility management alternatives, not valuation via P/E10.
See also “Trading Country Stock Markets Based on Relative P/E10”, “Predictive Power of P/E10 Worldwide”, “Testing P/E10 in Developed Markets” and “P/E10 and Future Stock Market Returns”.