Does the Chicago Board Options Exchange Market Volatility Index (VIX), a measure of investor expectations for stock market volatility (and arguably of current level of fearfulness), exploitably predict stock market direction? In their April 2007 paper entitled “Can the VIX Signal Market’s Direction? An Asymmetric Dynamic Strategy”, flagged by a reader, Alessandro Cipollini and Antonio Manzini investigate the relationship between VIX and future S&P 500 Index returns at a three-month horizon. To accommodate long-term variation in VIX (regime changes), they relate VIX to its 24-month rolling historical average. To accommodate non-linearity in the relationship between VIX and future returns, they segment the rolling history into 22 percentiles and assign the current VIX to one of 23 classes ranging from 0 (a 24-month low) to 22. They use 13 years of their sample for in-sample testing and two years for out-of-sample testing. Using daily closing levels of VIX and the S&P 500 index during January 1990 through early January 2007, they find that:
- There is apparently no useful linear (simple regression) relationship between VIX level and three-month future S&P 500 Index returns.
- On an in-sample basis (an investor operating in real time would not know the results), expected S&P 500 Index returns are high (low and sometimes negative) when VIX falls into high (low) classes. In particular:
- Three-month future S&P 500 Index returns increase systematically with VIX class.
- The model is less discriminating for future returns for when VIX is in low classes.
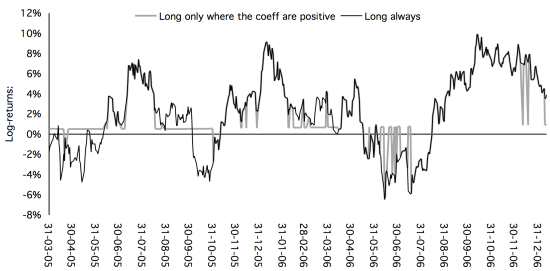
- During the two-year out-of-sample test period, a strategy that each day invests in the S&P 500 Index (risk-free asset) whenever VIX is in class 3 or above (below class 3) on average beats buying and holding the index on a gross basis over the next three months (see the chart below).
The following chart, taken from the paper, compares three-month returns for the two-year out-of-sample test strategy to S&P 500 Index buy-and-hold three-month returns. The test strategy each day invests in the S&P 500 Index whenever VIX is in class 3 or above (when the in-sample test indicates positive future stock market returns) and in LIBOR whenever VIX is below class 3.
Results indicate that the test strategy tends to avoid negative stock market returns while capturing positive returns. However, note that an actual investor could not allocate capital in this way.

In summary, evidence from tests accommodating a non-linear relationship between VIX relative to its two-year historical range and stock market returns over the next three months indicates a potentially exploitable relationship, with high (low) relative VIX indicating strong (weak) future returns.
Cautions regarding findings include:
- As noted above, the use of overlapping three-month future return intervals is not consistent with realistic allocation of capital by investors and may be materially misleading. For example, investors who have already allocated capital as relative VIX increases to class 3 cannot allocate again and again as VIX class subsequently rises to higher classes.
- Return calculations are gross, not net. Including realistic trading frictions for switching between between a stock index proxy and the money market would reduce test strategy profitability.
- The out-of-sample test period is extremely short in terms of independent 24-month VIX ranking intervals (only one) and independent three-month future return intervals (only eight).
- It appears that the use of 22 percentiles within each ranking interval may involve data snooping.
- Tests of statistical significance assume return distributions are well-behaved. To the extent return distributions are wild, these tests break down.
Compare and contrast these findings with those in “VIX and Future Stock Market Returns” and “Purifying Stock Market Sentiment Indicators”.