Can the forward-looking aspect of the S&P 500 Volatility Index (VIX) amplify technical analysis? In their September 2011 paper entitled “Using VIX Data to Enhance Technical Trading Signals”, James Kozyra and Camillo Lento apply nine simple technical trading rules (three each moving average crossovers, filters and trading range breakouts) to VIX to generate daily trading signals for the S&P 500 Index, the NASDAQ index and the Dow Jones Industrial Average. They reason that a relatively high (low) level of VIX indicates strong (weak) future stock index returns, so technical rules that separate daily levels of VIX into high and low regimes should aid trading. They compare results for VIX rule signals to those for signals generated by applying the rules to the indexes themselves. In all 27 cases (nine rules times three indexes), rule implementation assumes going long (short) an index on the day after buy (sell) signals. Estimated trading friction accounts for the bid-ask spread and a broker fee at the time of each trade. Using daily closes for VIX and the three indexes for January 1999 through July 2009, they find that:
- Over the entire sample period, VIX technical signals beat buying and holding the indexes for 22 of 27 cases. VIX technical signals beat index technical signals for 17 of 27 cases.
- Subperiod results indicate that VIX technical signals may not be effective when market volatility is low:
- During January 1, 1999 through June 25, 2003: VIX technical signals beat buying and holding indexes for 23 of 27 cases.
- During June 26, 2003 through August 17, 2007: VIX technical signals beat buying and holding indexes for only 2 of 27 cases.
- During August 18, 2007 through July 31, 2009: VIX technical signals beat buying and holding indexes for 19 of 27 cases.
In summary, evidence indicates that, when U.S. stock market volatility is relatively high, applying simple technical rules to VIX may be more effective for trading broad U.S. stock indexes than applying the same rules to the indexes themselves.
Cautions regarding findings include:
- Descriptions of technical rules and trading frictions are vague. Results apparently include no cost of shorting.
- The sample period, and especially the subperiods, are short relative to some of the rule generation intervals. For example, there are only about 13 completely independent 200-day intervals in the entire sample.
- There is no investigation of the threshold below which VIX technical analysis is ineffective.
- The NASDAQ 100 Volatility Index (VXN) maybe more appropriate than VIX for technical analysis of the NASDAQ index.
- Indexes are not directly tradable. Results for tradable proxies such as index and inverse index exchange-traded funds may be different.
Since these cautions are potentially decisive, we try a few simple tests of VIX 200-day, 100-day and 50-day simple moving average (SMA) crossover rules as applied to S&P 500 SPDR (SPY) and ProShares Short S&P 500 (SH) from inception of the latter on Jun 21, 2006 through September 2011. Tests derive from the following assumptions:
- Switch from SPY (SH) to SH (SPY) when VIX crosses below (above) its SMA at the close on the day after crossovers.
- Vary SPY-SH switching friction (bid-ask spreads and broker fees for two trades) from 0.0% to 1.0% per switch for sensitivity testing.
- Ignore tax implications of trading.
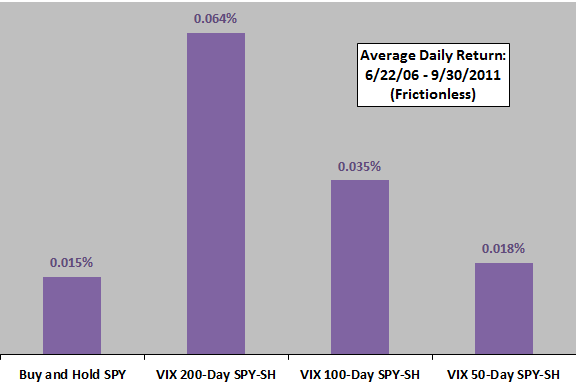
The following chart summarizes the average daily returns for buying and holding SPY and for the three VIX SMA strategies applied to SPY-SH over the available sample period with no trading friction. Results are favorable for all three SMA rules. Since the timing strategies are long-short, standard deviations of daily returns for the four alternatives are similar.
What happens when we include trading frictions?

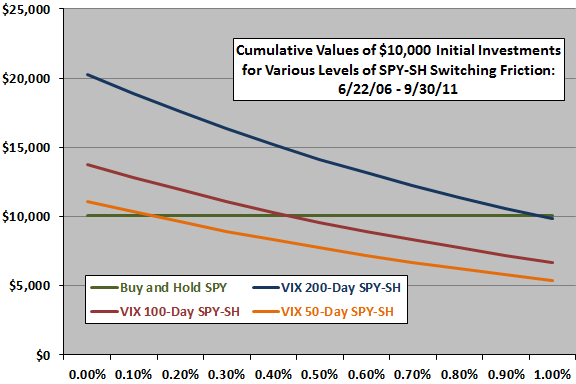
The next chart compares cumulative values of the four alternatives at the close on September 30, 2011 for trading frictions varying from zero to 1.0% per switch. The 200-day, 100-day and 50-day VIX SMA rules generate 72, 108 and 130 switches, respectively, so results are fairly sensitive to level of trading friction. In other words, the volatility of VIX generates a lot of switches.
Results indicate that 200-day SMA signal effectiveness is fairly robust to trading frictions, but the faster SMAs are not.
Also, accelerating or delaying signal implementation by one day makes material differences in cumulative returns (both lowering cumulative return for the 200-day SMA signal). This sensitivity to exact implementation timing suggests either a short sample period (large role for randomness) or some systematic short-term VIX behavior after crossovers. Said differently, a one-day delay in 200-day SMA signal implementation is somewhat lucky.

In summary, these independent tests generally support the findings in the paper. However, the sample period is very short for this kind of analysis, and results may be much less attractive in periods that are less turbulent.