Low-risk investment strategies buy or overweight low-risk assets and sell or underweight high-risk assets. Growth in low-risk investing is stimulating much pro and con debate in the financial community. Which assertions are valid, and which are not? In their February 2020 paper entitled “Fact and Fiction about Low-Risk Investing”, Ron Alquist, Andrea Frazzini, Antti Ilmanen and Lasse Pedersen identify five facts and five fictions about low-risk investing. They employ long-short U.S. stock portfolio strategies to illustrate relative performance of low-risk versus high-risk assets. They consider six statistical and four fundamental risk metrics, emphasizing differences between dollar-neutral and market-neutral strategy designs. Focusing on a few prominent low-risk metrics, they compare performances of low-risk strategies to those based on conventional size, value, profitability, investment and momentum factors. Using daily returns for U.S. stocks since January 1931 and firm fundamental data since January 1957, all through August 2019, they find that:
- The facts:
- Low-risk strategies are strong historically, with uniformly positive 6-factor (adjusting for market, size, book-to-market, profitability, investment and momentum) gross alphas. However, 2 of 10 strategies exhibit near zero gross raw returns and gross Sharpe ratios.
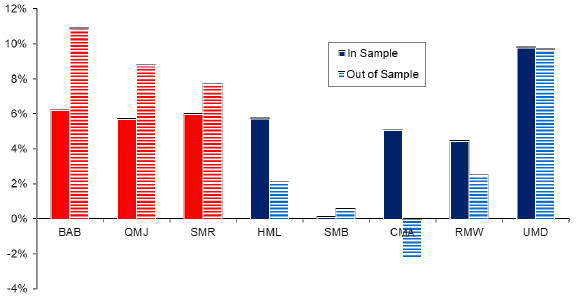
- Unlike other widely accepted factors, several prominent low-risk factors have higher out-of-sample than in-sample returns (see the chart below).
- Low-risk strategies are robust across country equity markets and other asset classes.
- The idea of low-risk investing conflicts with the standard Capital Asset Pricing Model (CAPM) but is consistent with theories of leverage constraints (high-beta assets are overpriced because asset managers who cannot use leverage seek them) and lottery preferences (highly volatile assets are overpriced by investors seeking big paydays).
- Low-risk strategies can generate negative returns in down markets, depending on their design and on breakdown of beta measurement during crashes.
- The fictions:
- Low-risk strategies are less attractive than those based on other widely accepted factors. In fact, several low-risk strategies have higher market-adjusted gross returns than size, value, profitability and investment factors (but not than the high-turnover momentum factor).
- Low-risk strategies depend on bond-like industries for performance. In fact, low-risk strategies work within and across industries.
- Low-risk strategies are particularly sensitive to portfolio reformation costs and work only for small-cap stocks. In fact, 9 of 10 low-risk equity strategies have monthly turnovers 40% or less, compared to 26% for conventional value and 100% for conventional momentum.
- Low-risk strategies are now expensive and unattractive going forward. In fact, low-risk stocks are expensive based on the historical value spread (difference in average book-to-market ratios between long and short sides). However, this condition has held during a long period of strong low-risk strategy performance, illustrating the difficulty of timing factors based on value spreads.
- CAPM is dead and so is low-risk investing. In fact, if CAPM is dead, low-risk investing is alive.
The following chart, taken from the paper, shows in-sample (solid columns) and out-of-sample (striped columns) 6-factor alphas for long-short U.S. stock portfolios based on three prominent low-risk factors (red) and five conventional factors (blue). The factors are:
- Betting Against Beta (BAB), with in-sample period January 1931 through December 1965.
- Quality Minus Junk (QMJ), with in-sample period July 1957 through January 2012.
- Stable Minus Risky betas (SMR), with in-sample period January 1931 through December 1965.
- High Minus Low book-to-market ratios (HML), with in-sample period July 1963 through December 1990.
- Small Minus Big market capitalizations (SMB), with in-sample period January 1936 through December 1975.
- Conservative Minus Aggressive investment (CMA), with in-sample period July 1963 through December 2013.
- Robust Minus Weak profitability (RMW), with in-sample period July 1963 December 2013.
- Up Minus Down momentum (UMD), with in-sample period January 1965 through December 1989.
Out-of-sample periods begin the next month after in-sample periods and extend through August 2019. Results show that low-risk strategies, in contrast to conventional factor strategies, perform better out-of-sample than in-sample.
In summary, evidence indicates that that low-risk investing has and continues to work well across asset classes.
Cautions regarding findings include:
- Analyses are gross, not net. Periodic portfolio reformation and shorting costs, which vary considerably over time, would reduce all returns. Shorting may not always be feasible as specified. Costs may vary by risk metric/factor, confounding net performance comparisons.
- Testing many risk metrics/factors on the same data introduces data snooping bias, such that the best-performing strategy overstates expectations.
- Some empirical arguments in the paper focus on just one or a few of the 10 low-risk strategy alternatives, amplifying concern about snooping bias.
- Strategies considered are beyond the reach of many investors, who would bear fees for delegating to a fund manager.