Are stock betas calculated with price jumps (arguably derived from informed trading) more useful than those calculated conventionally (arguably dominated by noise trading)? In the December 2014 version of their paper entitled “Roughing Up Beta: Continuous vs. Discontinuous Betas, and the Cross-Section of Expected Stock Returns”, Tim Bollerslev, Sophia Zhengzi Li and Viktor Todorov compare the powers of standard or “smooth” stock betas and jumpy or “rough” stock betas to predict stock returns. They measure smooth beta in two ways: from 75-minute returns during normal trading hours; and, from daily close-to-close returns. They measure rough beta also in two ways: from unusual jumps among 75-minute returns during normal trading hours; and, from close-to-open (overnight) returns. For all beta measurements, they employ the past year as the measurement interval. Using intraday prices and firm characteristics for the 985 stocks included in the S&P 500 Index during 1993 through 2010 (an average of 738 stocks per month), they find that:
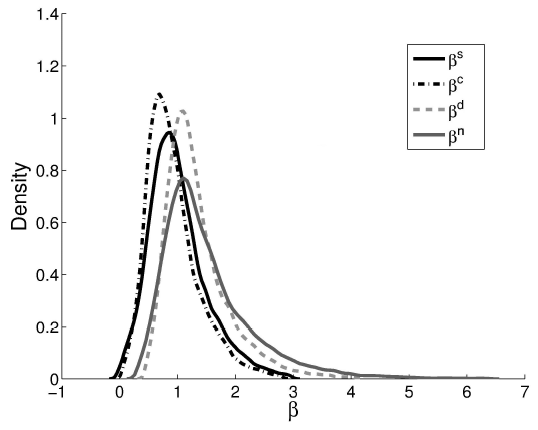
- Rough betas are more dispersed than smooth betas (see the chart below).
- All four betas relate negatively to book-to-market ratio and positively to momentum and idiosyncratic volatility. The smooth (rough) betas relate negatively (positively) to illiquidity. Stocks with higher rough betas tend to have smaller market capitalizations.
- Rough betas are better able to predict gross returns and gross four-factor (market, size, book-to-market, momentum) alphas than smooth betas. A hedge portfolio that is each month long the equally weighted fifth of stocks with the highest past betas and short the fifth with the lowest past betas generates average gross monthly returns (alphas) of:
- 0.83% (0.58%) for betas calculated from close-to-close returns.
- 0.71% (0.51%) for betas calculated from 75-minute intraday returns.
- 0.93% (0.64%) for betas calculated using intraday jump returns.
- 1.11% (0.85%) for betas calculated using overnight returns.
- The higher premiums of rough betas remain significant after controlling for a long list of firm characteristics and explanatory variables.
- Results are also robust to use of other intraday sampling frequencies, other beta calculation methods, different beta measurement intervals, different portfolio holding intervals and exclusion of several important macroeconomic news announcement days.
The following chart, taken from the paper, compares distributions of the four betas averaged across stocks and over time, as follows:
- Superscript “s” is for betas calculated from close-to-close returns.
- “c” is for betas calculated from 75-minute intraday returns.
- “d” is for betas calculated using intraday jump returns.
- “n” is for betas calculated using overnight returns.
The rough betas (d and n) are higher on average, more right-skewed and more dispersed than the smooth betas (s and c).

In summary, evidence indicates that rough (jumpy) betas are better able to predict stock returns than conventional smooth betas.
Cautions regarding findings include:
- Reported returns and alphas are gross, not net. Accounting for trading frictions from monthly portfolio reformation and shorting costs would lower performance. Shorting of some stocks may not be feasible.
- As noted, rough betas relate positively to illiquidity, suggesting that stocks with high rough betas tend to be more costly to trade than those with low rough betas.
- Individuals likely cannot hold enough stocks to ensure reliable capture of rough beta premiums. Funds managing to capture such premiums would charge fees that diminish them.