What is the best risk management approach for a conventional stock momentum strategy? In their August 2019 paper entitled “Enhanced Momentum Strategies”, Matthias Hanauer and Steffen Windmueller compare performances of several stock momentum strategy risk management approaches proposed in prior research. They use the momentum factor, returns to a monthly reformed long-short portfolio that integrates average returns from 12 months ago to two months ago with market capitalization, as their base momentum strategy (MOM). They consider five risk management approaches:
- Constant volatility scaling with 6-month lookback (cvol6M) – scales the base momentum portfolio to a constant target volatility (full sample volatility of the base strategy) using volatility forecasts from daily momentum returns over the previous six months (126 trading days).
- Constant volatility scaling with 1-month lookback (cvol1M) – same as cvol6M, but with volatility forecasts from daily momentum returns over the previous month (21 trading days).
- Dynamic volatility scaling estimated in-sample (dynIS) – enhances constant volatility scaling by also forecasting momentum portfolio returns based on market return over the past two years using the full sample (with look-ahead bias).
- Dynamic volatility scaling estimated out-of-sample (dyn) – same as dynIS, but with momentum portfolio return forecasts from the inception-to-date market subsample.
- Idiosyncratic momentum (iMOM) – sorts stocks based on their residuals from monthly regressions versus market, size and value factors from 12 months ago to one month ago (rather than their raw returns) and scales residuals by monthly volatility of residuals over this same lookback interval.
They evaluate momentum risk management strategies based on: widely used return and risk metrics; competition within a mean-variance optimization framework; and, breakeven portfolio reformation frictions. Using monthly and daily returns in U.S. dollars for U.S. common stocks since July 1926 and for common stocks from 48 international markets since July 1987 (July 1994 for emerging markets), all through December 2017, they find that:
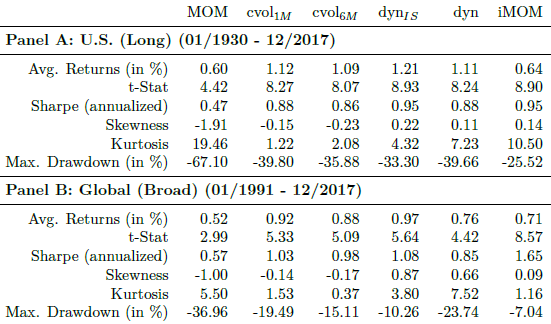
- All risk management strategies have much higher annualized gross Sharpe ratios and much shallower maximum drawdowns than MOM (see the table below) for both U.S. and international samples. iMOM wins for both metrics and samples, with:
- U.S. sample gross Sharpe ratio 0.95 and maximum drawdown -26% (versus 0.47 and -67% for the MOM).
- International sample gross Sharpe ratio 1.65 and maximum drawdown -7% (versus 0.57 and -37% for MOM).
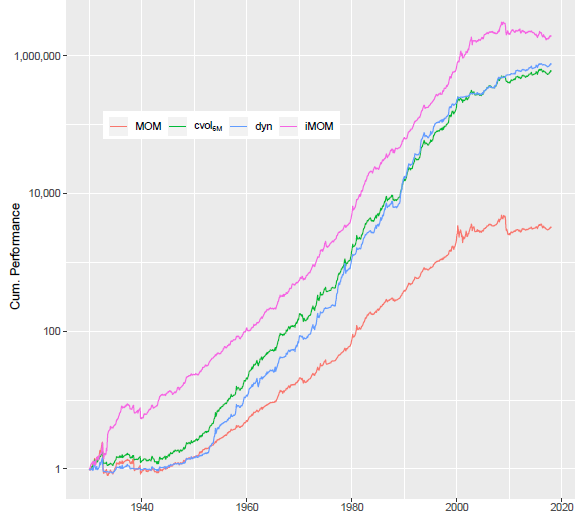
- Highest cumulative gross returns in both samples (see the chart below).
- For full-sample (retrospective) mean-variance optimization that maximizes Sharpe ratio via allocations to market, size, value, MOM, cvol6M, dyn and iMOM:
- The allocation to iMOM (42%) is by far the largest for the U.S. sample.
- The allocation to iMOM (52%) is again by far the largest for the international sample.
- iMOM also wins alternative Sharpe ratio maximization tests.
- Average monthly portfolio turnovers range from 54% (50%) for MOM to 82% (81%) for dyn in the U.S. (international) sample. Corresponding breakeven trading frictions range from 0.14% to 1.03% depending on confidence level, momentum strategy and sample.
- Volatility scaling alpha is distinct from idiosyncratic momentum alpha, such that applying cvol and dyn approaches to iMOM offers a further boost to gross Sharpe ratio in both samples, with cvol working better.
The following table, taken from the paper, compares gross performance statistics for the MOM and the five risk-managed momentum strategies specified above across U.S. and international stock samples. Results show that risk-managed strategies generally boost average return, increase strategy reliability, boost Sharpe ratio, tame return distributions and make maximum drawdowns shallower.

The following chart, also from the paper, compares cumulative gross performances of MOM, cvol6M, dyn and iMOM for the U.S. sample. All are scaled to full-sample MOM volatility for comparability. Notable points are:
- iMOM wins based on cumulative return. Its advantage over volatility scaling comes very early in the sample and during the early 2000s.
- In recent years, neither MOM nor iMOM perform well. An investor trying iMOM over the last decade may have given up.
In the international sample iMOM also wins, more impressively than in the U.S. sample, and with better recent performance.

In summary, evidence indicates that stock momentum investors may be able to boost performance by applying volatility scaling to conventional momentum or by using idiosyncratic rather than conventional momentum, with the latter alternative more attractive overall.
Cautions regarding findings include:
- Performance statistics and cumulative performance graphs are gross, not net. Accounting for monthly portfolio reformation frictions and shorting costs/constraints would lower these results. The breakeven analysis in the paper does not address shorting costs/constraints.
- As noted in the paper, the in-sample dynamic volatility scaling approach assumes full-sample knowledge for momentum return forecasts, and the associated look-ahead bias affects performance.
- Testing multiple strategies on the same samples introduces data snooping bias, such that the best-performing strategy overstates expectations. Moreover, the selected risk management methods may inherit data snooping bias from the prior research from which they were taken.
- Monthly data collection/processing and portfolio maintenance are (far) beyond the reach of most investors, who would bear fees for delegating this work to a fund manager.
See also “SACEMS with Risk Parity?” for a risk management horse race among variants of the Simple Asset Class ETF Momentum Strategy.