Does return distribution skewness predict relative performance of assets across asset classes? In their December 2019 paper entitled “Cross-Asset Skew”, Nick Baltas and Gabriel Salinas investigate realized skewness as a relative return predictor within and across four asset classes (equity indexes, government bonds, currencies and commodities). Specifically, at the end of each month, they:
- For each asset, measure skewness using daily returns over the last 12 months.
- Within each asset class, rank assets by skewness and reform a skewness portfolio that is long rank-weighted assets with relatively low (most negative) skewnesses and short those with relatively high (least negative or positive) skewnesses, with equal dollars allocated to the long and short sides.
- Scale each asset class skewness portfolio to full-sample volatility of 10%, and reform a Global Skewness Factor (GSF) portfolio that equally weights these scaled asset class portfolios.
Using daily returns for 19 equity index futures, 9 government bond futures, 9 currency forwards and 24 commodity futures series, along with monthly value, momentum and carry factor returns, during January 1990 through December 2017, they find that:
- Over the full sample period, average asset return skewnesses range from -0.60 to -0.08 for equity index futures, -0.34 to 0.13 for government bond futures, -0.22 to 0.45 for currency forwards and -0.43 to 0.14 for commodity futures.
- For asset class skewness portfolios, full-sample gross annualized Sharpe ratios are 0.39 for equity index futures, 0.44 for government bond futures, 0.00 for currency forwards and 0.57 for commodity futures.
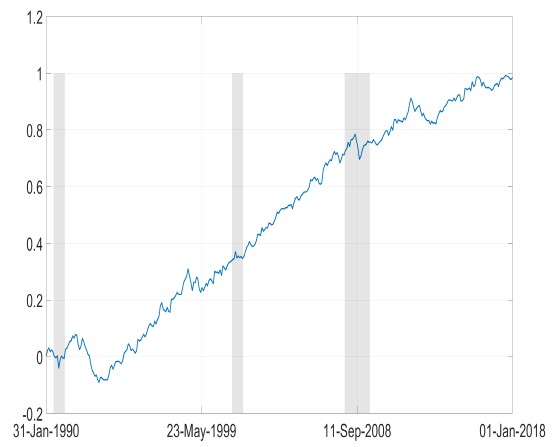
- Asset class skewness portfolios exhibit low pairwise correlations (-0.12 to 0.14), offering substantial diversification benefits when combined. The GSF portfolio specified above generates gross annualized Sharpe ratio 0.72 (see the chart below).
- Skewness portfolio returns are distinct from those for value, momentum and carry factors, such that mean-variance optimal multifactor portfolios assign a positive weight to skewness.
- Findings are robust for different skewness measures and subsamples.
The following chart, taken from the paper, tracks cumulative monthly gross return of the GSF portfolio over the full sample period. The mostly steady gains reflect the value of diversifying across asset class skewness portfolios.

In summary, evidence indicates that asset return skewness may be useful as a return predictor within and across most asset classes.
Cautions regarding findings include:
- Results are gross, not net. Trading frictions associated with monthly portfolio reformation would reduce returns and Sharpe ratios.
- Reported gross Sharpe ratios for skewness portfolios are not remarkably high, and the 0.00 Sharpe ratio for currency forwards undermines an assertion of pervasive predictive power for realized skewness.
- Scaling asset class skewness portfolios to 10% full-sample volatility when combining them into the GSF portfolio incorporates look-ahead bias. Results may differ for a realistic implementation.
- Methods are beyond the reach of some investors, who would bear fees for delegating to a fund manager.
For related research, see results of this search.