Findings in “Add Stop-gain to Asset Class Momentum Strategy?” suggest that systematic capture of upside volatility may enhance the base strategy. Does this conclusion hold for a simpler application to a single liquid asset over a longer sample period? To investigate, we apply a stop-gain rule to SPDR S&P 500 (SPY) that: (1) exits SPY if its intra-month return exceeds a specified threshold (sacrificing any dividend paid that month); and, (2) re-enters SPY at the end of the month. We also look at a corresponding stop-loss rule. Using monthly unadjusted highs, lows and closes (for stop-gain and stop-loss calculations) and dividend-adjusted closes (for return calculations) for SPY during February 1993 through February 2020, we find that:
Specific trading assumptions for the stop-gain rule are:
- The stop-gain threshold ranges from 1% to an integer at which there are no stop-outs.
- If the monthly unadjusted high for SPY exceeds its unadjusted close at the end of the prior month by at least the stop-gain threshold, we exit at the stop-gain threshold. Otherwise, we hold to the end of the month.
- Trading frictions for stopping out and re-entering (two-way) ranges from 0.0% to 0.5%.
- Return on cash while stopped out (after settlement delays) is zero. The effect of this simplification varies with interest rates and number of stop-outs.
- Friction for dividend reinvestment is zero, and there are no tax implications of trading.
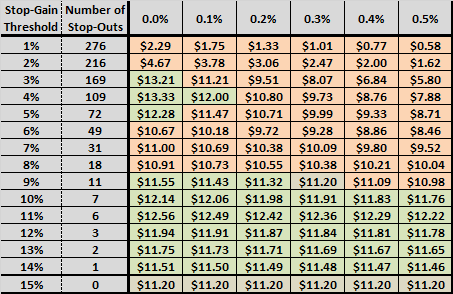
The following table summarizes terminal values of $1.00 initial investments in SPY at the end of February 1993 for stop-gain thresholds ranging from 1% to 15% (left column) and two-way stop-out/re-entry frictions ranging from 0.0% to 0.5% (top row). Terminal values that are greater (less) than the $11.20 for buy-and-hold are shaded green (orange). It appears that, for thresholds of 9% and higher, the stop-out/re-entry process tends to miss some short-term downward reversion after price spikes. However, given the modeling assumptions and the small number of trades for high thresholds, benefits of stop-gain/end-of-month re-entry are not compelling.
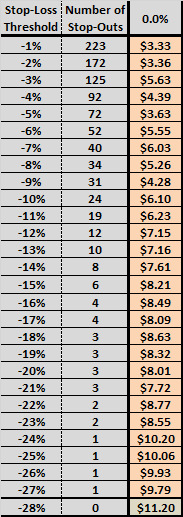
What about a comparable stop-loss rule?
The next table summarizes terminal values of $1.00 initial investments in SPY at the end of February 1993 for stop-loss thresholds ranging from -1% to -28% and two-way stop-out/end-of-month re-entry frictions of 0.0%. Even for the frictionless case, all terminal values are less than the $11.20 for buy-and-hold. It appears that, for all thresholds, the stop-out/re-entry process tends to miss some short-term upward reversion after price drops.
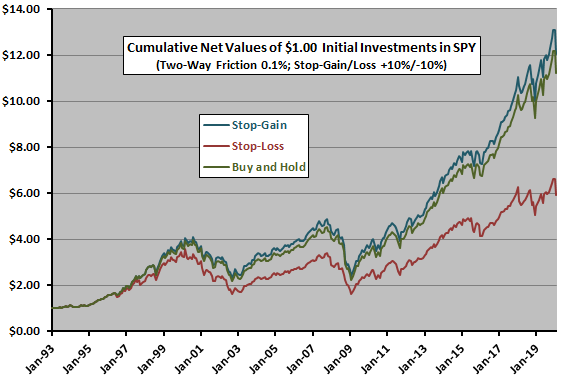
For additional perspective, we plot cumulative values for selected stop-gain and stop-loss thresholds, with nominal two-way trading frictions.
The following chart compares net cumulative values of $1.00 initial investments in SPY at the end of February 1993 for:
- A stop-gain/end-of-month re-entry rule with threshold 10% (seven stop-outs) and two-way trading frictions of 0.1%.
- A stop-loss/end-of-month re-entry rule with threshold -10% (19 stop-outs) and two-way trading frictions of 0.1%.
- Buy-and-hold.
Ratios of average net monthly return to standard deviation of monthly returns are 0.21, 0.14 and 0.20, respectively. The simple timing rules offer little or no protection against major drawdowns.
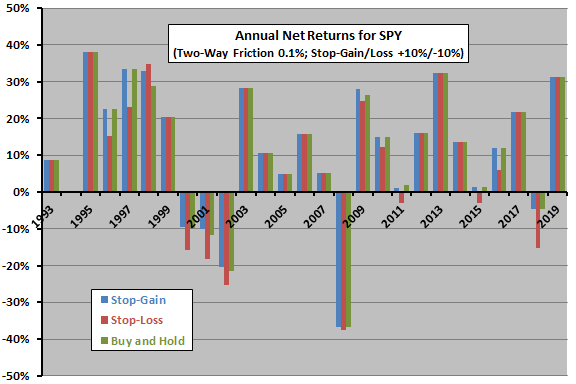
For still another perspective, we look at annual returns.
The final chart shows net returns by year for the same three strategy alternatives. Results indicate that stop-losses underperform stop-gains many more times than they outperform, and they underperform stop-gains during bear market years 2000-2002 and 2008.
Annual net Sharpe ratios for these returns, using average monthly 3-month U.S. Treasury bill yield during a year as the risk-free rate for that year, are 0.51, 0.35 and 050, respectively as listed. These results confirm that the benefit of stop-gain is marginal.
In summary, evidence suggests that a simple stop-gain rule (but not a comparable stop-loss rule) may have marginal value when applied to the broad U.S. stock market.
Adding nearly six years of data to the original 2014 study does not affect prior findings.
Cautions regarding findings include:
- As noted, the backtest makes simplifying assumptions regarding trading frictions, return on cash and tax implications of trading.
- Testing a range of thresholds introduces data snooping bias, such that the best-performing threshold likely overstates expected rule performance.
- The strategy depends on return distribution tail behaviors, which may not be stable over time.
- Some other stop-gain rule (such as a threshold adaptive to recent volatility, or a more elaborate re-entry calculation) may work better, but brute force experimentation impounds data snooping bias. In a test not shown, a one-month delay in re-entry after stop-gain stop-outs works worse. Introducing a return-based criterion for re-entry would introduce a trend following or reversion aspect to the strategy.
- Results may differ for other assets with different volatilities and return distribution tail behaviors.