How should investors evaluate the effectiveness of a safe haven asset? In their July 2020 paper entitled “A Safe Haven Index”, Dirk Baur and Thomas Dimpfl devise and apply a safe haven index (SHI) to evaluate over 20 individual potential safe haven assets. SHI consists of seven equal-weighted assets: gold, Swiss franc, Japanese yen, 2-year, 10-year and 30-year U.S. Treasuries and 10-year German government bonds. For evaluations, they focus on four safe haven events: the October 1987 stock market crash, the September 2001 terrorist attacks, the September 2008 Lehman collapse and the March 2020 COVID-19 pandemic. Using daily data for index components and other potential safe haven assets as available during January 1985 through May 2020, they find that:
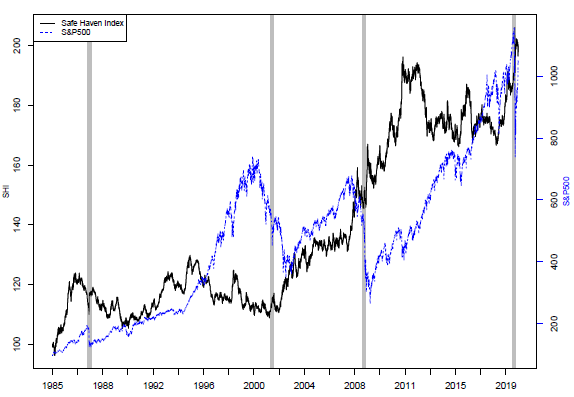
- When there is no crisis, SHI volatility is considerably lower than those of the S&P 500 Index and gold. During crises, SHI generates positive returns but with elevated volatility. Overall correlation of daily returns between SHI and the S&P 500 Index is -0.16 (see the chart below).
- Gold, silver, the yen and 30-year U.S. Treasuries all have strong positive betas relative to SHI and are thus good safe haven assets, but all have high volatility during crises.
- In contrast, Bitcoin has an insignificant beta relative to SHI.
- Among S&P 500 stocks, only Newmont Corporation is a good safe haven, while bond-like utility stocks behave as weak safe havens.
- There are significant differences in findings for daily and monthly returns, emphasizing the short-lived nature of safe haven events and associated price reactions of safe haven assets.
The following chart, taken from the paper, tracks SHI and the S&P 500 Index daily over the full sample period, with the four safe haven events identified above shaded gray. Overall, SHI tends to rise when the S&P 500 falls. However, the 1987 stock market crash seems to have been so strong that the safe haven index falls with the stock market. Similarly, SHI exhibits a slight downturn during the COVID-19 pandemic.

In summary, combining behaviors of multiple safe haven assets into a diversified index offers investors a means to evaluate effectiveness of individual safe haven assets.
Cautions regarding findings include:
- The sample is not large in terms of number of safe haven events.
- As noted in the paper, some assets considered are not available over the full sample period. For example, the Bitcoin sample starts in August 2001.
For related items, see results of this search.