Subscribers asked whether risk parity might work better than equal weighting of winners within the Simple Asset Class ETF Momentum Strategy (SACEMS), which each month selects the best performers over a specified lookback interval from among the following eight asset class exchange-traded funds (ETF), plus cash:
PowerShares DB Commodity Index Tracking (DBC)
iShares MSCI Emerging Markets Index (EEM)
iShares MSCI EAFE Index (EFA)
SPDR Gold Shares (GLD)
iShares Russell 2000 Index (IWM)
SPDR S&P 500 (SPY)
iShares Barclays 20+ Year Treasury Bond (TLT)
Vanguard REIT ETF (VNQ)
3-month Treasury bills (Cash)
To investigate, we focus on the SACEMS Top 3 portfolio and compare equal weighting to risk parity weights. We calculate risk parity weights at the end of each month by:
- Calculating daily asset return volatilities over the last 63 trading days (about three months, as suggested). This step includes Cash, which has very low volatility.
- Picking the volatilities of the Top 3 momentum winners.
- Weighting each winner by the inverse of its volatility.
- Scaling winner weights such that the total of the three allocations is 100%. This step essentially puts the entire portfolio into Cash when any of the Top 3 is Cash.
We use gross compound annual growth rates (CAGR) and maximum drawdowns (MaxDD) to compare strategies. We check robustness by trying lookback intervals of one to 12 months for both momentum ranking and volatility estimation (increments of 21 trading days for the latter). Using monthly dividend-adjusted closing prices for asset class proxies and the yield for Cash during February 2006 (when all ETFs are first available) through December 2018, we find that:
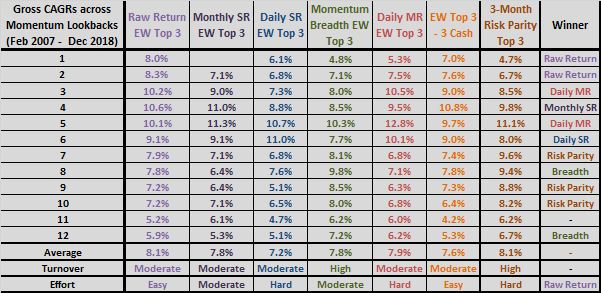
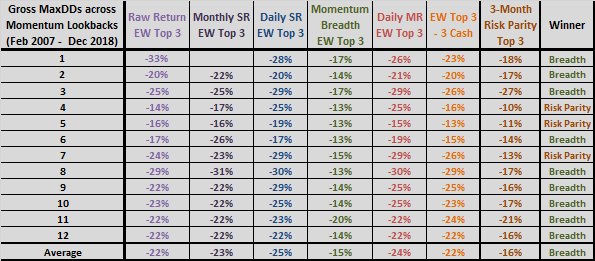
The following two tables compare gross CAGRs and MaxDDs for SACEMS Top 3 with equal weighting (Raw Return EW Top 3) or risk parity weighting (3-Month Risk Parity Top 3) across momentum ranking lookback intervals ranging from one to 12 months. First monthly returns are for March 2007 to accommodate the longest lookback interval of 12 months. The tables include comparable results for the following five additional SACEMS risk management strategies:
- Monthly SR EW Top 3 – Pick winners based on monthly asset Sharpe ratios (per “Robustness of SACEMS Based on Sharpe Ratio”).
- Daily SR EW Top 3 – Pick winners based on daily asset Sharpe ratios (per “Robustness of SACEMS Based on Sharpe Ratio”).
- Momentum Breadth EW Top 3 – Invoke crash protection when less than half of risk assets have positive past returns (the baseline case in “SACEMS with Momentum Breadth Crash Protection”).
- Daily MR EW Top 3 – Pick winners based on daily asset Martin ratios (per “SACEMS Based on Martin Ratio?”).
- EW Top 3 – 3 Cash – Same as Raw Return EW Top 3 but includes three copies of Cash in the universe (per “SACEMS with Three Copies of Cash”, essentially a dual momentum strategy).
Each table includes a “winner” column on the far right to denote which strategy has the best performance for each lookback interval.
First is the CAGR table with additional rows at the bottom showing for each strategy: (1) average CAGR across lookback intervals; (2) qualitative estimation of turnover; and, (3) qualitative estimation of the effort to set up, backtest and maintain (from an individual investor point of view). The 3-Month Risk Parity Top 3 strategy:
- Wins three of 12 momentum lookback intervals.
- Has a comparatively broad sweet spot of lookback intervals (3-month to 10-month).
- Is greater than 10% for only one lookback interval (5-month). This peak is very narrow, so is likely lucky.
- Ties Raw Return EW Top 3 for the highest average CAGR across all lookback intervals.
- Produces many large swings in allocations. For example: (1) as constructed, it triggers liquidation when any winner is Cash and full reinvestment when Cash drops out; and, (2) an asset switch affects scaling of holdover winner weights.
- Requires more logic/programming and use of daily prices for all assets in backtests and monthly updates.
Some risk-managed alternatives may involve related effects, such that a 5-month lookback interval is commonly informative or lucky.

Next is the MaxDD table with a row at the bottom showing average MaxDDs across lookback intervals. The 3-Month Risk Parity Top 3 strategy is a close second among all strategies in suppressing MaxDD and monthly portfolio return volatility, winning three of 12 lookback intervals.
For perspective, we look at cumulative performances of all strategies.

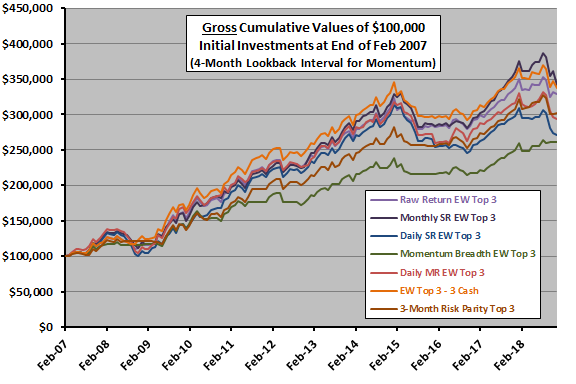
The following chart compares gross cumulative performances of $100,000 initial investments in the six strategies over the above sample period for the baseline SACEMS 4-month momentum ranking lookback interval. Per the CAGR table above, the 4-month lookback interval is optimal for Raw Return EW Top 3 (and EW Top 3 – 3 Cash) and therefore favorable to this strategy. Notable points are:
- Trajectories for most strategies are tightly bunched.
- No one strategy leads all the time.
- Most strategies suffer drawdowns in 2008 and 2015.
Are findings for Risk Parity Top 3 robust to using other volatility estimation lookback intervals.

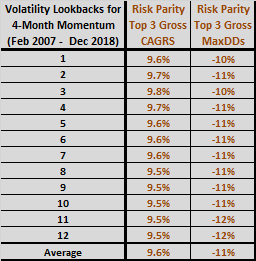
The final table compares Risk Parity Top 3 CAGRs and MaxDDs across volatility estimation lookback intervals ranging from one month (21 trading days) to 12 months (252 trading days), all for a 4-month momentum ranking lookback interval. Notable points are:
- Results are not very sensitive to volatility estimation lookback interval.
- Shorter lookbacks generally work a little better than longer ones.
- A 3-month lookback is optimal and may convey some data snooping bias.

In summary, available evidence indicates that SACEMS Top 3 with risk parity may be attractive to very crash-averse investors who can handle associated complexity and high turnover efficiently.
Cautions regarding findings include:
- Sample size is modest (about 13 independent 12-month lookback intervals), especially in terms of variety of market conditions.
- As noted, analyses are gross. Accounting for costs of monthly portfolio reformation would reduce returns. As noted, turnovers differ among competing strategies, with that for risk parity relatively high.
- Testing multiple lookback intervals and different ranking strategies introduces data snooping bias, such that the best-performing combinations overstate expectations. Bias increases with the number of strategies and parameter settings tested. Strong, sharp peaks in performance may expose outcomes due to luck.
- Results may differ materially for different asset universes.
- As noted, calculating strategy inputs with daily data is relatively complicated and time consuming.