Is reward-for-risk or reward-for-not taking risk the rule among stocks? In their April 2012 paper entitled “Low Risk Stocks Outperform within All Observable Markets of the World”, Nardin Baker and Robert Haugen measure performance differences between low-volatility stocks and high-volatility stocks in developed and emerging equity markets worldwide. They define a stock’s lagged volatility as the standard deviation of its monthly total returns over the past 24 months. Each month beginning in 1990, they form ten (apparently) equally weighted portfolios in each country ranked by lagged volatility. They then calculate the differences in average annualized gross returns, standard deviations of annualized gross returns and annualized gross Sharpe ratio (estimated as the ratio of average return to volatility) between the portfolios with the lowest and highest lagged volatilities. Using monthly returns for broad samples of stocks in 21 developed and 12 emerging markets during 1988 through 2011 (288 months), they find that:
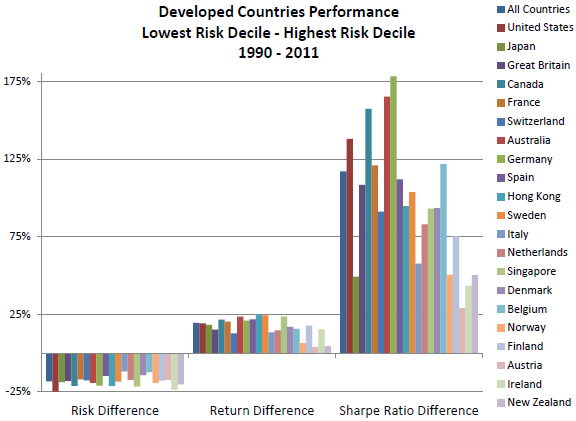
- For developed countries (see the first chart below), differences between low-volatility and high-volatility portfolios indicate that:
- Past volatility is uniformly a good predictor of future volatility. Stocks with low (high) past return volatility tend to continue exhibiting low (high) volatility.
- Low-volatility stocks uniformly tend to outperform high-volatility stocks based on gross return.
- Low-volatility stocks therefore uniformly tend to outperform high-volatility stocks based on gross Sharpe ratio.
- Based on differences in rolling three-year gross returns, high-volatility portfolios very seldom outperform low-volatility portfolios.
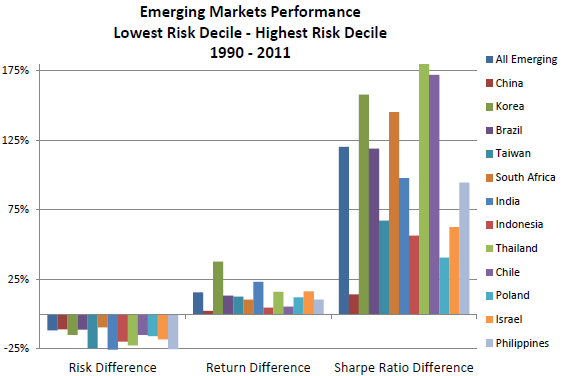
- Results are similar for emerging market stocks (see the second chart below).
- Results from ranking into five portfolios and two portfolios (rather than ten) based on lagged volatility are consistent.
- For the approximately 1,000 largest U.S. stocks during 2000 through 2009: (1) financial institutions hold more volatile stocks; (2) analyst coverage is significantly greater for more volatile stocks; and, (3) news coverage is more intense for more volatile stocks. These factors point to attention-based overpricing (and future underperformance) of volatile stocks.
The following two charts, taken from the paper, summarize differences in average annualized gross returns, standard deviations of annualized gross returns and annualized gross Sharpe ratio between the portfolios with the lowest and highest tenths of lagged 24-month volatilities (standard deviations of monthly returns). The upper (lower) chart covers 21 developed (12 emerging) country stock markets.
Results indicate that stocks with relatively low lagged volatilities tend to generate higher future gross return at lower volatility than stocks with relatively high lagged volatilities overall and in each of the 33 countries.


In summary, evidence indicates that, pervasively worldwide, stocks with relatively low realized volatility generate higher future returns at lower risk than stocks with with relatively high realized volatility.
The authors extrapolate to recommend that investors not use capitalization-weighted portfolios as core holdings, because the performance of such portfolios derives mostly from relatively volatile, overvalued growth stocks.
Detailed results from the study are available at lowvolatilitystocks.com.
Cautions regarding findings include:
- Measuring volatility at different frequencies and different lagged intervals may affect results.
- Although not the principal point of the study, implied hedge portfolio performance (low volatility minus high volatility) is problematic because:
- Returns and Sharpe ratios are gross, not net. Including reasonable trading frictions would reduce reported returns. The study reports average portfolio turnover in developed countries at about 100% per year.
- Costs of shorting would also reduce reported returns, and shorting of many stocks may not be feasible.
- Findings are for stocks only.