Are there advantages to using leveraged exchange-traded funds (ETF) to implement conventional asset class exposures? In their October 2018 paper entitled “A Portfolio of Leveraged Exchange Traded Funds”, William Trainor, Indudeep Chhachhi and Chris Brown investigate performance of diversified portfolios of 2X or 3X leveraged ETFs that limit exposures to those typically achieved with 1X ETFs. Specifically, when using 2X (3X) funds, allocations are only one half (one third) those for corresponding 1X ETFs. While this approach allows large allocations to a safe asset, it also exposes the portfolio to the higher expense ratios, internal financing costs, leverage decays and rebalancing frequencies of leveraged ETFs. The authors two strategic allocations:
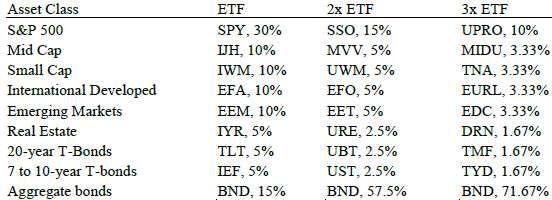
- Actual ETFs during 2010-2017 (see the first table below) – 1X portfolio allocations are 30% U.S. large caps, 10% U.S. midcaps, 10% U.S. small caps, 10% non-U.S. developed market stocks, 10% emerging market stocks, 5% real estate investment trusts (REIT), 5% >20-year U.S. Treasuries, 5% 7-year to 10-year U.S. Treasuries and 15% aggregate corporate bonds. “Savings” from holding leveraged ETFs goes to the aggregate bond ETF, for which there are no leveraged counterparts. Rebalancing occurs whenever equities combined deviate from the specified overall levels by more than 10%.
- Simulated ETFs during 1946-2017 – 1X portfolio allocations are 50% S&P 500, 10% U.S. midcaps, 10% U.S. smallcaps, 15% >20-year U.S. Treasuries, 15% 7-year to 10-year U.S. Treasuries. An equal-weighted ladder of 1-year, 2-year, 5-year and 7-year U.S. Treasuries. “Savings” from holding leveraged ETFs goes to an equal-weighted ladder of 1-year, 2-year, 5-year, and 7-year treasury bonds. Rebalancing occurs whenever equities combined deviate from the specified overall level by more than 10%.
Using daily returns for specified ETFs since 2010 and data required to simulate specified ETFs since 1946, all through December 2017, they find that:
- On average during 2010-2017, 50% of 2X (33% of 3X) actual leveraged ETFs underperform 1X counterparts by -0.9% (-0.9%) per year, ranging from -0.4% to -1.5% (0.0% to -1.6%).
- For the 2010-2017 test of a portfolio constructed from actual ETFs (see the second table below):
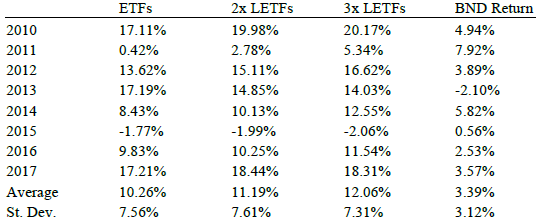
- Average annual gross return for the 2X (3X) leveraged ETF portfolio is 11.2% (12.1%), compared to 10.3% for the baseline 1X portfolio.
- Standard deviation of annual returns for the 2X (3X) leveraged ETF portfolio is 7.6% (7.3%), compared to 7.6% for the baseline 1X portfolio.
- Substantial portions of leveraged ETF portfolio returns come from the large aggregate bond ETF allocations. Whenever this return is at least 2.5%, the leveraged ETF portfolios outperform.
- For the 1946-2017 test of a portfolio constructed from simulated ETFs:
- Average annual gross return for the 2X (3X) leveraged ETF portfolio is 11.8% (12.5%), compared to 11.1% for the baseline 1X portfolio.
- Standard deviation of annual returns for the 2X (3X) leveraged ETF portfolio is 13.2% (13.5%), compared to 12.7% for the baseline 1X portfolio.
- Annualized gross Sharpe ratio for the 2X (3X) leveraged ETF portfolio is 0.57 (0.62) per year, compared to 0.55 for the baseline 1X portfolio.
- Annualized gross Sortino ratio for the 2X (3X) leveraged ETF portfolio is 2.93 (3.34) per year, compared to 2.56 for the baseline 1X portfolio.
- Leveraged ETF portfolios outperform the 1X portfolio about 76% of the time, most strongly when interest rates are relatively high during 1979-1991.
- Bootstrapping simulation based on 1946-2017 data generally confirms findings.
- The 10% rebalancing threshold generates 24, 243 and 651 rebalancing actions for the 1X, 2X and 3X portfolios, respectively. Assuming $5 a trade, this turnover represents 0.01%, 0.10% and 0.27% trading frictions per year for $100,000 portfolios.
The following table, taken from the paper, summarizes allocations for actual 1X, 2X and 3X ETF portfolios during 2010-2017, along with symbols for each. There is no leveraged version of BND, which is the repository of “savings” associated with use of leveraged ETFs.

The next table, also from the paper, compares annual gross returns and volatilities for the 1X, 2X and 3X portfolios in the above table. It also shows returns for the BND portion of the portfolio, which is the repository of “savings” associated with use of leveraged ETFs. Results indicate that BND performance is critical to leveraged ETF portfolio performances compared to 1X.

In summary, evidence suggests that using leveraged ETFs to achieve conventional asset class exposures may be attractive.
However, the following cautions suggest that the level of attractiveness is not compelling based on assumptions made and other uncertainties:
- Reported results are generally gross, not net. The $5 per trade assumption used for the long-term test dramatically understates contemporaneous stock trading frictions. Moreover:
- Derivatives needed to simulate leveraged ETFs did not exist over much of the sample period. Estimating contemporaneous costs of constructing and maintaining such derivatives is problematic.
- Market effects from availability of such derivatives and the leveraged ETFs themselves is unknown for much of the sample period.
- The sample period for the test of actual ETFs is very short and largely a bond bull market, favorable to the specified allocation strategy. During a bond bear market, the leveraged ETF strategies may mostly underperform the 1X benchmark.
- The safety of leveraged ETFs may depend on the financial health of the offeror. The offeror may unilaterally change the terms of the ETFs and may even default.
See also “Simple Asset Class Leveraged ETF Momentum Strategy” and “SACEMS with Margin”.