Are exchange-traded funds (ETF) efficient from a trading frictions perspective? In the October 2015 version of their paper entitled “ETF Liquidity”, Ben Marshall, Nhut Nguyen and Nuttawat Visaltanachoti examine magnitude of trading frictions, best liquidity metric, time-variation in liquidity time and liquidity-return relationship across a large number of ETFs. Their universe consists of 870 ETFs: 571 equity (411 U.S. and 160 international), 83 bond, 17 commodity, 19 currency, 25 real estate, and 155 “other” that involve leveraged or short exposures to any asset classes. They employ the Dow Jones Industrial Average ETF (DIA) to relate ETF liquidity to underlying asset liquidity. They consider three trading friction metrics: (1) effective spread (twice the absolute difference between natural logarithms of price and bid-ask midpoint); (3) quoted spread (ask minus bid divided by midpoint); and, (3) price impact (five-minute changes in midpoint). Using tick and daily data for the selected ETFs and DIA components during 1996 through 2014, they find that:
- The number of ETFs in the universe grows from 19 in 1996 to 643 in 2014.
- Over the entire sample period:
- Average effective spreads are 0.19% for commodity, 0.20% for currency, 0.20% for bond, 0.27% for U.S. equity and 0.57% for international equity ETFs. Parts of variations derive from different start dates.
- Average quoted spreads are larger than corresponding average effective spreads, ranging from 0.24% for commodity to 0.75% for international equity ETFs.
- Price impacts are relatively lower and ordered differently, ranging from 0.13% for commodity to 0.27% for “other” ETFs.
- Comparing DIA to the price-weighted average of component stocks:
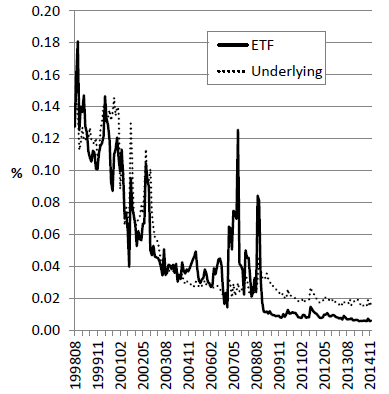
- DIA average effective spread declines from 0.075% during 1998-2005 to 0.021% during 2006-2014, compared to 0.083% and 0.023%, respectively, for components (see the chart below).
- The correlation between DIA and component effective spreads is 0.80 over the entire sample period, but only 0.46 during 2006-2014. Changes in underlying stock liquidity influence DIA liquidity up to ten days later.
- Change in market liquidity, as proxied by change in VIX, has strong impact on ETF liquidity.
- ETFs generally become much more costly to trade during market crises.
- Drops in market liquidity accompany low returns for eight of ten ETF groups, and ETF prices respond more quickly than individual stocks to market liquidity shocks.
- End-of-day bid-ask spread, high-low and Amihud liquidity (impact of turnover on price) are the best measures of actual trading frictions.
- There are a few intraday, daily and quarterly anomalies:
- Effective ETF spreads are generally highest during the first half hour of trading.
- Some ETF groups exhibit low spreads at the end of the day, but others do not.
- Some ETF groups exhibit high spreads on Monday, but others do not.
- Spreads are relatively high during the fourth quarter for most ETFs.
The following chart, taken from the paper, compares evolutions of effective bid-ask spreads for DIA and the price-weighted average of its component stocks over the sample period. Trading frictions mostly decrease over time, but ETF trading frictions can spike during market crises. ETF trading frictions are recently low compared to those of components.

In summary, evidence indicates that ETFs are generally (except during market crises) efficient with respect to trading frictions, which have declined considerably over the past two decades.
Cautions regarding findings include:
- Results do not account for broker fees as an element of trading frictions.
- As shown in the paper, average trading frictions substantially understate those borne during market crises, working against emergency escapes (stop-loss rules).