What is the best way to avoid stock momentum portfolio crashes? In her July 2019 paper entitled “Momentum with Volatility Timing”, Yulia Malitskaia tests a long-only volatility-timed stock momentum strategy that exits holdings when strategy volatility over a past interval exceeds a specified threshold. She focuses on a recent U.S. sample that includes the 2008-2009 market crash and its aftermath. She considers the following momentum portfolios:
- WML10 – each month long (short) the tenth, or decile, of stocks with the highest (lowest) returns from 12 months ago to one month ago.
- W10 and L10 – WML10 winner and loser sides separately.
- WML10-Scaled – adjusts WML10 exposure according to the ratio of a volatility target to actual WML10 annualized daily volatility over the past six months. This approach seeks to mitigate poor returns when WML10 volatility is unusually high.
- W10-Timed – holds W10 (cash, with zero return) when W10 volatility over the past six months is below (at or above) a specified threshold. This approach seeks to avoid poor post-crash, loser-driven WML10 performance and poor W10 performance during crashes.
She performs robustness tests on MSCI developed and emerging markets risk-adjusted momentum indexes. Using daily and monthly returns for W10 and L10 portfolios since 1980 and for MSCI momentum indexes since 2000, all through 2018, she finds that:
- WML10 performs well during the 2008-2009 financial crisis but has a deep, abrupt crash of its own as the broad market begins to recover. L10 drives both aspects of performance, with exceptionally poor returns during the crisis and exceptionally good returns (beating W10) in its aftermath.
- WML10-Scaled avoids about half the WML10 post-crisis crash, but underperforms the broad market thereafter through 2018.
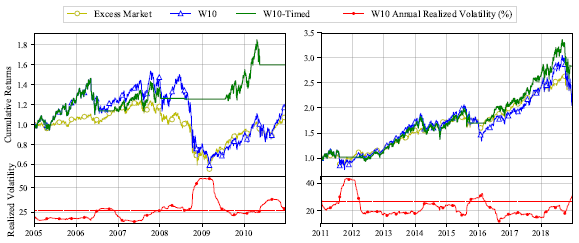
- W10-Timed with annualized volatility threshold 27% avoids the WML10 post-crisis crash by exiting stocks during the crisis and, on a gross basis, performs reasonably well during 2005-2018 (see the chart below).
- Extending the U.S. W10-Timed test back to 1980 shows that 3-month and 6-month lookback intervals for volatility measurement exhibit materially different results in older data, indicating that there is no consistently optimal lookback.
- Applying volatility timing to MSCI momentum indexes with annualized volatility threshold 27% for eight developed market indexes and 40% for three emerging market indexes consistently enhances gross average monthly returns and gross monthly Sharpe ratios.
- W10-Timed generally beats published time series momentum strategies during both 2005-2010 and 2011-2018 subperiods.
The following charts, taken from the paper, compare gross cumulative performances of the broad stock market, W10 and W10-Timed with 27% annualized volatility threshold during 2005-2010 (left) and 2011-2018 (right). Each chart also shows W10 annualized volatility based on the last six months of daily returns. Results suggest that W10-Timed effectively avoids W10 (and broad market) crashes and is otherwise competitive with the market on a gross basis.

In summary, evidence suggests that timing a long-only stock momentum portfolio by exiting when portfolio volatility is unusually high enhances momentum performance.
Cautions regarding findings include:
- Reported results are gross, not net. Accounting for trading frictions from monthly portfolio reformation of WML10 and W10, and for shorting costs of WML10, would reduce momentum strategy returns. Shorting may not always be feasible as assumed for WML10. The study does not address effects of scaling and timing on momentum portfolio turnover.
- A test of W10-Timed versus the broad market similarly timed would help isolate benefits of W10.
- The author’s suggestion that an investor can replace W10-Timed when its volatility is above target assumes that a replacement strategy allows favorable exits when signals for re-entering W10-Timed occur.
- Adding complexity to momentum strategies adds ways to snoop recent data.
- Testing WML10, W10, WML-Scaled and W10-Timed on the same sample is one way to impound data snooping bias (favorable randomness) such that the best-performing alternative overstates expectations.
- Within W10-Timed, a researcher can snoop: (1) momentum ranking lookback interval; (2) W10 volatility threshold for exiting W10; and, (3) lookback interval for W10 volatility measurement. Brute force optimization of these parameters also impounds data snooping bias.