Is selling insurance against stock market volatility reliably profitable? In the December 2010 version of his paper entitled “Variance Trading and Market Price of Variance Risk”, Oleg Bondarenko examines payoffs from synthesized variance swap contracts, derived from the difference between realized and contract-specified variances over a given interval, during a 20-years period. He constructs the hypothetical swap contracts from observed prices of S&P 500 Index futures and options on these futures. Using daily prices for these futures and options from January 1990 through December 2009, he finds that:
- Over the entire sample period, the U.S. stock market gross variance risk premium (average variance swap contract payoff) is -26.3% per month, economically very large compared to the market risk premium of 0.38% per month.
- Systematically selling hypothetical S&P 500 Index variance swap contracts produces a gross monthly Sharpe ratio of 0.42, about five (1.75) times larger than the gross Sharpe ratio for the index (for systematically selling at-the-money put options on S&P 500 Index futures). Hedging and optimization strategies boost this Sharpe ratio to 0.44-0.45.
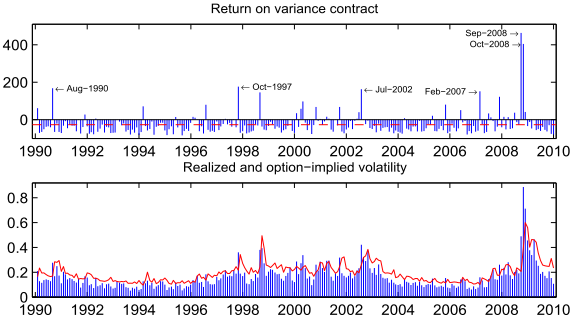
- The distribution of the variance swap contract returns is highly non-normal, exhibiting substantial positive skewness (a few very large positive payoffs, as shown in the chart below).
- Neither the commonly used market, size and book-to-market risk factors nor S&P 500 Index futures option returns completely explain the variance risk premium. There is evidence that variance risk is related to proxies for credit, liquidity and correlation risks.
The following charts, taken from the paper, relate the monthly hypothetical S&P 500 Index variance swap contract returns (upper chart) to realized and swap contract-implied index volatilities (lower chart) during 1990 through 2009.
The upper chart shows that monthly variance swap contract returns (blue columns) are predominantly negative, but punctuated by occasional very large positive returns. The dashed red line is the sample mean.
The lower chart shows that the swap contract-implied index volatility (red line) is generally higher than realized volatility (blue columns). When the reverse is true (such as August 1990, October 1997, August 1998, September 2001, July 2002, September 2008 and October 2008), swap contracts exhibit positive payoffs.
In other words, investors systematically selling S&P 500 Index variance swap contracts earn a fairly steady stream of moderate monthly returns with occasional large losses.

In summary, evidence indicates that investors may be able to generate strong abnormal returns by systematically selling variance swap contracts because others are willing to pay a high premium for protection against variation in volatility.
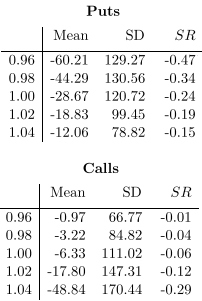
See “Is 40% Per Month Shorting Index Puts a Fair Return?” for a summary of the author’s prior work on the premium from selling put options on S&P 500 Index futures. The current paper updates return calculations for various options on S&P 500 Index futures through 2009, as follows, where the first column indicates option moneyness, the second column is the average monthly return in percent, the third column is the standard deviation (SD) of monthly returns in percent and the fourth column is monthly Sharpe ratio (SR) for systematically buying puts and calls over the entire 1990-2009 sample period. See the discussion of the validity of profitability estimates in “Is 40% Per Month Shorting Index Puts a Fair Return?”.

Cautions regarding findings include:
- Profitability calculations seem not to account for capital reserves necessary to account for varying margin requirements while holding (or shorting) synthetic variance swaps. These reserves are likely substantial, materially lowering reported returns. For example, investors allocating all capital to selling variance swap contracts would have gone bust in August 1990, October 1997, August 1998, September 2001, July 2002, September 2008 and October 2008. The last two events would have been especially traumatic. More prudent investors holding sufficient capital reserves to protect against such events would earn much lower than reported returns.
- Profitability calculations appear to be gross of trading frictions involved in constructing synthetic variance swap contracts. Including reasonable trading frictions would reduce reported returns.
- As described in the paper, the distribution of returns from selling variance swaps is non-normal, such that “normal” interpretations of statistics (mean monthly return, standard deviation of monthly returns and Sharpe ratio) lose meaning as future performance indicators. A few future events (like September and October 2008) might materially change these statistics for the entire distribution.
- Hypothetical variance swap contracts convey no means for market adaptation. In other words, it seems plausible that trading of actual variance swap contracts (rather than an abstract, retrospective scenario) may have affected the variance risk premium and the behavior of variance itself.