Does predictable end-of-day rebalancing behavior of leveraged exchange-traded funds (ETF) present trading opportunities? In their October 2012 paper entitled “Intraday Share Price Volatility and Leveraged ETF Rebalancing”, Arthur Rodier, Edgar Haryanto, Pauline Shum and Walid Hejazi examine: (1) the effects of leveraged ETF rebalancing activities on late-day market volatility; and, (2) the profitability of trading strategies designed to anticipate these rebalancing activities. For the former, they measure the average intraday volatility of 346 large-capitalization stocks within indexes tracked by many leveraged ETFs. For the latter, they consider intraday trades of ProShares Ultra S&P500 (SSO) and ProShares UltraShort S&P500 (SDS) according to whether anticipated late-day rebalancing pressure is likely to be bullish or bearish, respectively. Using intraday returns for the S&P 500 Index, 346 individual S&P 500 stocks, SSO and SDS during late June 2006 through mid-July 2011, they find that:
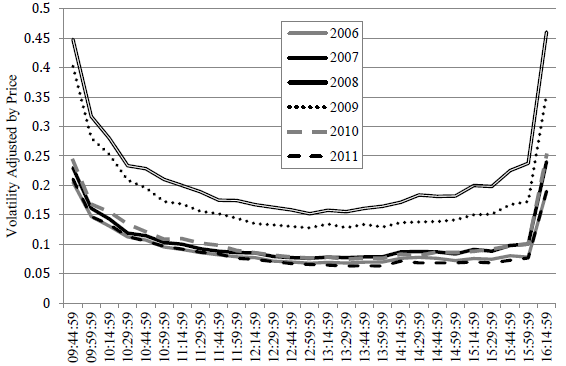
- Stock return volatility tends to be highest around the market open and the market close (see the first chart below). On days of large market moves, the open and close tails are larger and steeper, and the duration of the mid-day trough is shorter.
- On average, estimated aggregate rebalancing activities of leveraged ETFs explain about a third of late-day stock return volatility. This explanatory power increases to over 50% on days when the market gains or loses at least 3% by 3:30pm.
- Trading strategies that buy SSO (SDS) in mid-afternoon when the market gains (loses) at least 2% by that time and sell at the close generate large cumulative gross returns over the sample period. Specifically:
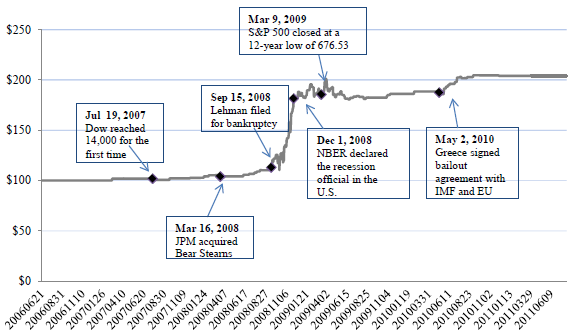
- A strategy based strictly on market price movement by 2:45 pm yields an average gross return of 0.60% per trade and a cumulative gross return of 104% over the sample period (see the second chart below). Only 44 of 128 such trades (34%) produce a gross loss.
- An alternative strategy based on market price movement by 2:30 pm that incorporates estimated magnitude of aggregate rebalancing activities by leveraged ETFs yields an average gross return of 0.66% per trade and a cumulative gross return of 119% over the sample period. Only 45 of 127 such trades (35%) produce a gross loss.
- For both strategies, cumulative return concentrates strongly in late 2008. Neither of these two strategies trades in 2006 or 2011. The first strategy trades in 2007, but the alternative does not.
The following chart, taken from the paper, summarizes average volatility of 346 large-capitalization U.S. stocks by 15-minute intervals during 9:30 am to 4:14 pm for each of calendar years 2006 through 2011. Intraday volatility has a “U” shape, with volatility steadily dropping until mid-day, then gradually rising to a spike at the close.

The next chart, also from the paper, plots the cumulative gross value of a $100 initial investment in the price-only trading strategy described above, which buys SSO (SDS) at 2:45 pm when the market gains (loses) at least 2% by that time. This strategy yields an average gross trade return of 0.60% and a cumulative gross return of 104% over the entire sample period. However, profits concentrate strongly during 2.5 months in late 2008, and the strategy does not trade in 2006 or 2011.

In summary, evidence suggests that front-running the rebalancing activities of leveraged equity ETFs may be very profitable when the U.S. stock market experiences extreme stress.
Cautions regarding findings include:
- Returns from trading SDS and SSO are gross, not net. Including reasonable trading frictions, likely largest when gross profitability is highest, would reduce reported returns. For the 128 trades in the first strategy above, a crude estimate of breakeven round-trip trading friction is 0.6%.
- As noted, trading strategy profitability concentrates strongly during extreme market conditions in late 2008 and is at other times not so interesting.
- There is some data snooping bias in determination of the optimal trading strategy rules, such that results likely overstate reasonable out-of-sample expectations.
- As noted in the paper, market adaptation may have reduced trading strategy profitability.