An upward (downward) trend in implied volatilities with option maturity indicates that investors expect volatility to increase (decrease) over time. Do such expectations reliably predict future stock options prices? In his October 2011 paper entitled “Volatility Term Structure and the Cross-Section of Option Returns”, Aurelio Vasquez investigates whether the implied volatility term structure (measured as slope of implied volatilities across at-the-money options with receding expiration dates) predicts future option returns. Specifically, each month he ranks stocks into deciles by volatility term structure slope and then calculates future returns for extreme deciles from five option trading strategies: (1) naked calls; (2)naked puts; (3) straddles; (4) delta-hedged calls; and, (5) delta-hedged puts. He calculates returns relative to the initial prices of the options traded. Using monthly closing bid and ask prices for at-the-money options (moneyness between 0.95 and 1.05) on a broad sample of U.S. stocks, and associated firm characteristics, during January 1996 through June 2007 (260 stocks per month on average), he finds that:
- Over the entire sample period, the average slope of the monthly volatility term structure ranges from -15.0% for decile 1 to 8.5% for decile 10. These extremes represent stocks with implied volatilities currently well above and below their long-term means, respectively, with mean reversion expected.
- Option portfolios with the most positive volatility term structure slopes significantly outperform those with the most negative. For example, over the entire sample period:
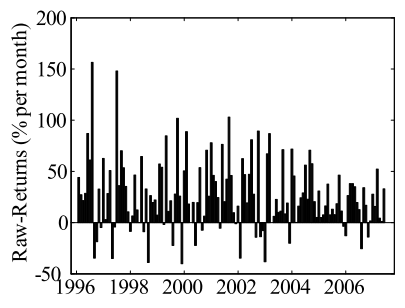
- A hedge portfolio that each month buys (sells) straddles for the tenth of stocks with the highest (lowest) volatility term structure slopes generates an average monthly gross return of 27.1%, with 14.8% (12.2%) coming from the long (short) side. 81% of the monthly gross returns are positive.
- Similar hedge strategies using naked calls, naked puts, delta-hedged calls and delta-hedged puts generate average monthly gross returns of 35.7%, 25.6%, 4.0% and 3.5%, respectively with 61%, 63%, 81% and 81% of monthly gross returns positive.
- Assuming trading friction equal to the bid-ask spread (1.1 times the bid-ask spread), the hedge strategy employing:
- Straddles generates an average monthly net return of 12.3% (10.9%).
- Naked calls generates an average monthly net return of 15.0% (13.3%), with hardly any contribution from the short side.
- Naked puts generates an average monthly net return of 7.6% (6.0%), with the contribution from the long side negative.
- Delta-hedged puts generates an average monthly net return of 0.8%% (0.6%).
- Delta-hedged calls generates an average monthly net return of 1.5% (1.3%).
- Gross results are robust to different setups, adjustments for common risk factors, and characteristic sorts. Average monthly gross returns for the hedge strategy using straddles are 29.9% during 1996-2000 and 24.9% during 2001-2007, with a decrease in trading frictions more than compensating for the lower gross profitability.
The following chart, taken from the paper, shows the time series of monthly gross return for a hedge portfolio that each month buys (sells) straddles for the tenth of stocks with the highest (lowest) volatility term structure slopes over the 1996-2007 sample period. Average monthly gross return is 27.1%, with 81% of the monthly returns positive.
The paper presents similar charts for hedge strategies executed with naked calls, naked puts, delta-hedged calls and delta-hedged puts.

In summary, evidence indicates that investors may be able to generate abnormal returns via option strategies that are long (short) options of those individual stocks with the most positive (negative) implied volatility term structures.
Cautions regarding findings include:
- The study calculates returns relative to option prices and not relative to required margin plus capital reserve. Return on capital based on broker margin requirements for the largest expected drawdown would be much lower.
- It would be interesting to extend the data through the 2008-2009 financial crisis to understand how crises might affect indicator performance.
- Trading frictions used in the study account for the bid-ask spread but do not address broker commissions/fees.
- The slope metric used assumes the term structure is essentially linear. A non-linear term structure model might produce better results.
- Statistical significance tests in the paper assume a tame return distribution. Distribution wildness diminishes confidence in the test.