Does focusing on downside risk (volatility or beta) consistently produce more accurate forecasts of asset returns? In their July 2018 paper entitled “Tail Risk in the Cross Section of Alternative Risk Premium Strategies”, Bernd Scherer and Nick Baltas investigate how well downside risk explains cross-sectional returns of 260 risk factor strategies spanning asset classes and investment styles from six global investment banks. Their main model is a two-pass regression that distinguishes between conventional market beta and market downside beta. For corroboration, they consider four other indicators of downside risk (return skewness, correlation of tail returns with equity market returns, TED spread and economic policy uncertainty as measured by relative VIX level). Using weekly data risk factor returns and downside risk indicators during February 2008 through January 2018, they find that:
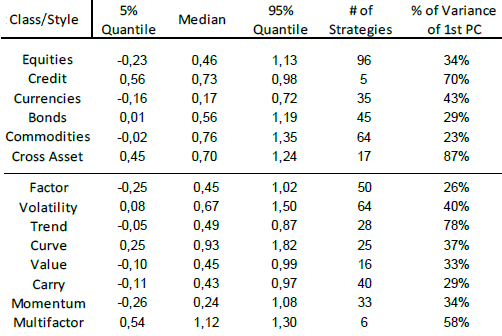
- Based on gross median returns, the 260 risk factor strategies are generally attractive on a gross basis (see the table below).
- Separately accounting for downside beta as a return predictor considerably improves a simple linear model of risk factor returns. In fact, about half of the risk factors have larger downside betas than traditional betas.
- However, downside betas are often negative. In other words, assuming downside risk is often penalized rather than rewarded.
- This finding is robust to changes in return measurement frequency and downside market definition.
- Excluding 2008 and 2009 from the sample makes downside betas largely positive and statistically significant, but such an exclusion seems unreasonable.
- Results are similar for the four alternative measures of downside risk, with improved model forecasts but negative risk-reward relationships.
The following table, extracted from the paper, summarizes gross annualized Sharpe ratios for extreme and median risk factor returns grouped by asset class (upper section) and investment style (lower section) over the 10-year sample period. Results indicate that the premiums are generally attractive. The table also lists the number of risk factor strategies in each group and the percentage of risk factor return variance explained by the first principal component (PC). Low values of this percentage indicate that explaining the risk factor returns is relatively difficult.

In summary, there is little evidence across asset classes and investment styles of reward for taking downside risk.
Cautions regarding findings include:
- Input strategy return data are likely gross, not net. Accounting for implementation frictions and management fees would lower returns and may affect findings.
- As noted in the paper, the sample period is very short in terms of tail events, and findings could therefore be specific to the sample.
- Input strategies may impound material data snooping bias and therefore overstate expectations for any new data.