A reader asked whether “good” or “bad” days are more likely to occur during times of high or low volatility. One measure of (realized) volatility is standard deviation of returns, such as the standard deviation of daily returns over the past 21 trading days. Using daily returns for the S&P 500 Index over the period January 1950 through April 2010, we find that:
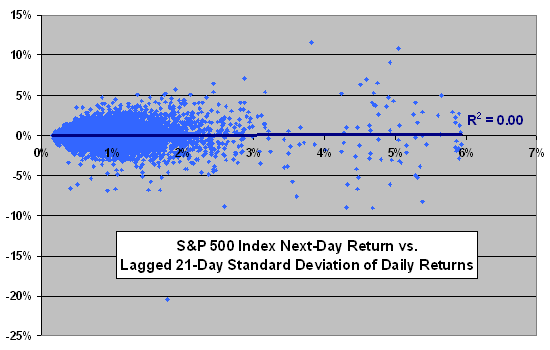
The following chart relates next-day return for the S&P 500 Index to the lagged 21-day standard deviation of daily returns over the entire sample period. If, for example, high volatility predicts poor next-day returns, a best-fit line should slope downward from left to right. However, the best-fit line is flat, and the R-squared statistic is 0.000 (indicating that realized volatility predicts 0.0% of next-day returns).
The outlier in the lower left of the chart is October 17, 1987.
In case there is a non-linear relationship, we focus on very high and very low volatilties.

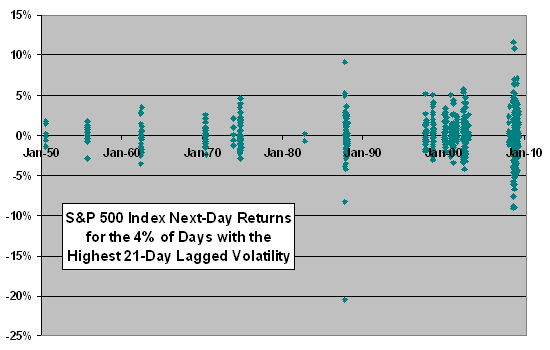
The next chart plots next-day S&P 500 Index returns for the 4% of days in the sample with the highest 21-day lagged volatility. Data fall into about a dozen clusters. Of these 606 days, 316 (52%) have positive returns and 287 (47%) have negative returns. The average daily return on positive (negative) days is 1.77% (-1.71%). The average daily return for all 606 days is 0.11%, compared to 0.03% for all days in the S&P 500 Index series.
The outlier at the bottom is again October 17, 1987.
Results make no obvious case that high volatility selectively signals good or bad days.
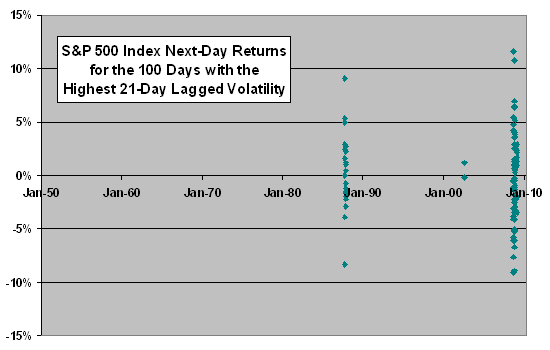
For robustness, we check just the 100 highest volatilities.

The next chart plots next-day S&P 500 Index returns for the 100 days in the sample with the highest 21-day lagged volatility. Data fall mostly into two clusters. Of these 100 days, 49 have positive returns and 51 have negative returns. The average daily return on positive (negative) days is 3.03% (-2.93%). The average daily return for all 100 days is -0.01%.
Again, results make no obvious case that high volatility selectively signals good or bad days.
What about the lowest volatilities?

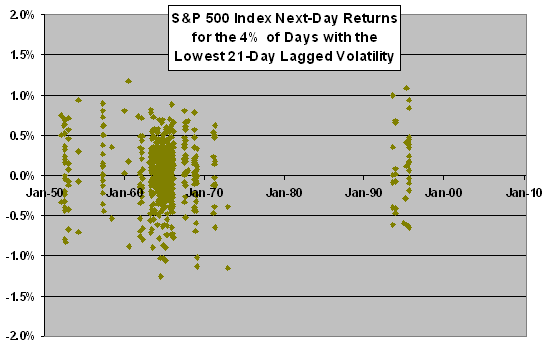
The final chart plots next-day S&P 500 Index returns for the 4% of days in the sample with the lowest 21-day lagged volatility. As for the highest-volatility days, data fall into about a dozen clusters. Of these 606 days, 343 (57%) have positive returns and 254 (42%) have negative returns. The average daily return on positive (negative) days is 0.30% (-0.30%). The average daily return for all 606 days is 0.05%, compared to 0.03% for all days in the S&P 500 Index series.
While the percentage of days with positive returns is higher here than for days after high volatilities, the average daily return is lower.

In summary, results from simple tests do not support a belief that an investor can readily filter good and bad daily stock market returns based on the level of realized volatility.