Are implied volatility futures good diversifiers of underlying indexes? Do implied volatility futures for different indexes represent a reliable pair trading opportunity? In their November 2013 paper entitled “Investment Strategies with VIX and VSTOXX Futures”, Silvia Stanescu and Radu Tunaru update the case for hedging conventional stock and stock-bond portfolios with near-term implied volatility futures for the S&P 500 Index (VIX) and the Euro STOXX 50 Index (VSTOXX). For this analysis, they use data for the U.S. and European stock market indexes, associated implied volatility futures and U.S. and European aggregate bond indexes from March 2004 for U.S. assets (VIX futures inception) and from May 2009 for European assets (VSTOXX futures inception), both through February 2012. They also investigate a statistical arbitrage (pair trading) strategy exploiting a regression-based prediction of the trend in the gap between VIX and VSTOXX during the last six months of 2012. Using daily data for the specified indexes and implied volatility futures contracts, they find that:
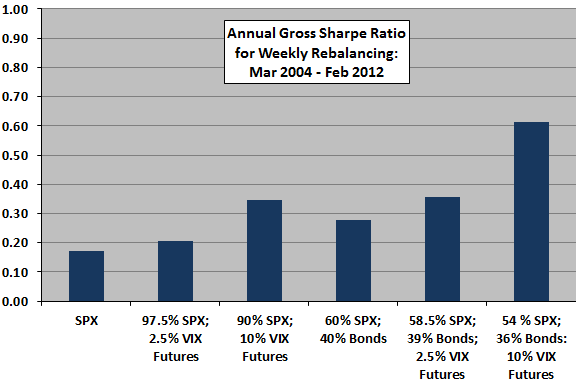
- Adding VIX (VSTOXX) futures to U.S. (European) stock and stock-bond portfolios with daily or weekly rebalancing improves gross Sharpe ratios and reduces value-at-risk (see the first chart below). For subperiods:
- In normal times such as 2004-2007, adding VIX futures improves the gross average returns and produces excellent gross Sharpe ratios.
- During turbulent times such as 2008-2012, adding VIX and VSTOXX futures maintains a positive gross average return and improves gross annual Sharpe ratios.
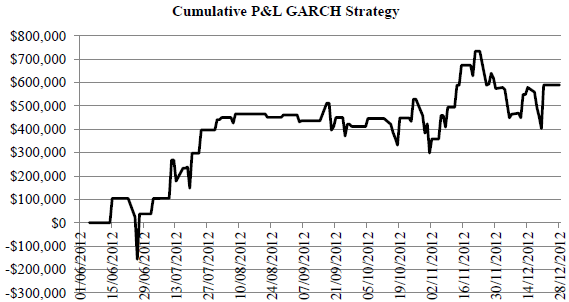
- A regression model is useful for predicting the one-day-ahead gap between VIX and VSTOXX futures based on a rolling historical window of 500 observations. Applying this prediction to go long (short) the nearest maturity VSTOXX (VIX) futures contract when the model predicts an increase in the gap and exiting these positions when the model predicts a decrease in the gap generates a large gross profit during June 2012 through December 2012 (see the second chart below).
The following chart, constructed from data in the paper, summarizes gross annual Sharpe ratios for various portfolios comprised of the S&P 500 Index (SPX), an aggregate U.S. bond index (Bonds) and VIX futures assuming weekly rebalancing over the period March 2004 through February 2012.
Accounting for the costs of weekly rebalancing would reduce the Sharpe ratios of all portfolios except SPX.

The next chart, taken from the paper, tracks the gross performance of a strategy that is long (short) $100,000 of nearest maturity VSTOXX (VIX) futures when the selected regression model (using 500 days of history) predicts an increase in the gap between VIX and VSTOXX futures and in cash when the model predicts a decrease in the gap.
The test period is 146 trading days, short compared to the 500-day regression measurement interval.

In summary, evidence suggests that investors with access to very low trading frictions may be able to diversify traditional stocks-bonds portfolios with implied volatility futures, and that pair trading of implied volatility futures across markets may be profitable.
Cautions regarding findings include:
- It appears that selection of the regression model and rolling historical window used in the VIX-VSTOXX pair trading test may involve snooping. The associated bias, exacerbated by concentration of gains in a few trades over a short test period, may materially overstate expected strategy performance.
- Capital requirements for the VIX-VSTOXX pair trading test are unclear, with the early loss in the second chart above implying a substantial capital reserve.
- The study generally ignores trading frictions. These frictions may be substantial for daily and weekly rebalancing of stocks-bonds portfolios, such that findings based on net returns may be materially different from those based on gross returns.
- The study uses indexes rather than tradable assets, thereby ignoring any costs associated with creating and maintaining tradable funds.