Does the effectiveness of simple moving average (SMA) crossing signals vary with stock volatility? In the August 2011 update of their paper entitled “A New Anomaly: The Cross-Sectional Profitability of Technical Analysis”, Yufeng Han, Ke Yang and Guofu Zhou investigate the application of SMAs to portfolios of stocks sorted based on realized volatility. Specifically, each year they sort stocks into deciles by volatility (standard deviation of daily returns over the past year). For each decile, they calculate a price index, an SMA for the index and daily returns based on initial equal weighting. When a decile portfolio is above (below) its SMA, they hold the portfolio (30-day Treasury bills), with a one-day delay for switches. They compare the returns for this timing strategy to buy-and-hold by decile. They focus on a 10-day SMA, but also test 20-day, 50-day, 100-day and 200-day SMAs. Using daily returns for a broad sample of U.S. stocks spanning 1963 through 2009, they find that:
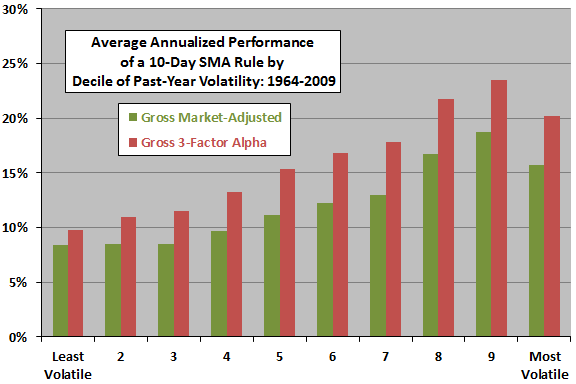
- The 10-day SMA rule generates gross annualized abnormal returns (above buy-and-hold) ranging from 8.4% for the least volatile decile to 18.7% for the second most volatile. Three-factor (adjusting for market, book-to-market, size) gross annualized alpha ranges from 9.8% to 23.7%. Variation is almost systematic across deciles (see the chart below).
- Standard deviations of annual returns are much lower for the 10-day SMA rule than for buy-and-hold, such that Sharpe ratios are three to four times higher for all volatility deciles. Sharpe ratios are highest for extreme volatility deciles and lowest for middle deciles.
- Gross abnormal returns decline as SMA measurement interval increases (20-day, 50-day, 100-day and 200-day), most noticeably among high-volatility deciles, but are still generally substantial.
- Trading frequency (profitability per trade) tends to increase (decrease) with volatility, especially for short-interval SMAs. Breakeven trading frictions therefore tend to be lower for high volatility, ranging from 0.29% for decile 8 (fairly volatile) of the 10-day SMA rule to 1.12% for decile 1 (least volatile) of the 50-day SMA rule. Results suggest considerable room for net profitability.
- SMA rule gross alphas are generally higher and steeper across volatility deciles during the first of two equal subperiods.
- SMA rule alphas are higher during recessions than expansions, but still significant under both conditions.
- The performance of the SMA is largely stronger than, and distinct from, momentum.
The following chart, constructed from data in the paper, summarizes average annualized gross abnormal returns (relative to buy-and-hold) and gross three-factor alphas for the 10-day SMA crossing rule across deciles of stocks sorted by past-year volatility during 1964-2009. Results suggest that the SMA rule is more effective for high-volatility than low-volatility stocks. However, standard deviations of returns also increase with volatility.

In summary, evidence indicates that the performance of simple moving average trading rules increases meaningfully across portfolios of stocks sorted from low to high past-year volatility.
Cautions regarding findings include:
- Trading frictions are high compared to breakeven during much of the sample period, to an extent that may preclude profitability (see “Trading Frictions Over the Long Run”). An examination of changes in breakeven trading friction over time would be useful.
- Individuals cannot reasonably trade the large number of stocks in the test portfolios. Trading with a few stocks would limit reliability.