Do low-volatility strategies work for all stocks? In their April 2015 paper entitled “Low Risk Anomalies?”, Paul Schneider, Christian Wagner and Josef Zechner examine relationships between low-beta/low-volatility stock anomalies and implied stock return skewness. They compute ex-ante (implied) skewness for each stock via a portfolio of associated options that is long (short) out-of-the-money calls (puts). The more investors are willing to pay for downside risk protection (puts), the more negative this measure becomes. Using stock and option price data for 5,509 U.S. stocks for which options are available during January 1996 through August 2014, they find that:
- Implied return skewness predicts stock returns.
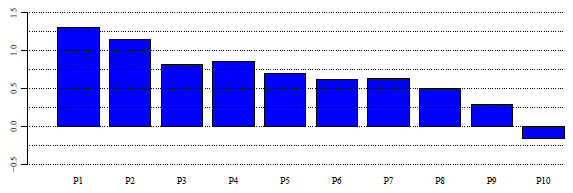
- A portfolio that is each month long the equally weighted tenth (decile) of stocks with the highest implied skewness generates an average gross monthly excess return (relative to the risk-free rate) of 1.46% and a four-factor alpha (controlling for market, size, value and momentum factors) of 1.31% (see the first chart below).
- A portfolio that is each month long the equally weighted tenth of stocks with the lowest (most negative) implied skewness generates an average gross monthly excess return of -0.10% and a four-factor alpha of -0.16%.
- The effectiveness of low-risk strategies depends on implied skewness of the stocks considered. Based on quintile sorts (ranked fifths) and equal weighting:
- Betting against beta or volatility is profitable (unprofitable) for stocks with low (high) implied skewness, meaning high (low) downside risk.
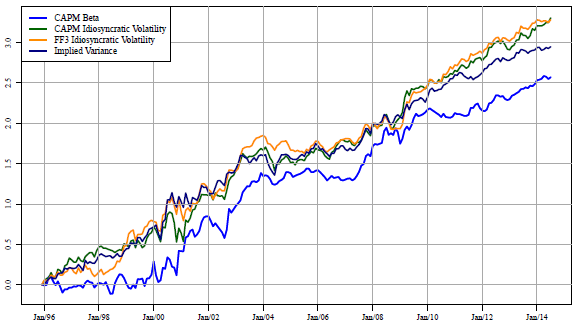
- Depending on the volatility metric, portfolios that each month bet against volatility among stocks with low implied skewness and bet on volatility among stocks with high implied skewness generates average gross monthly excess returns in the range 1.15%-1.48% and four-factor alphas in the range 1.18%-1.53% (see the second chart below).
Thee following chart, taken from the paper, compares gross monthly four-factor alphas for decile portfolios formed at the end of each preceding month based on implied skewness. Portfolio P1 (P10) contains stocks with the highest (lowest) implied skewness.

The next chart, also from the paper, compares gross cumulative excess returns of four hedge strategies that bet against various measures of risk among stocks with low implied skewness and bet on risk among stocks with high implied skewness. The setup involves independent quintile sorts on implied skewness and the risk metric. In general, gains are fairly consistent across subperiods and do not bear large drawdowns.

In summary, evidence indicates that implied (expected) skewness is a good predictor of stock returns, and that low-volatility stock strategies are effective only among stocks with relatively low expected skewness.
Cautions regarding findings include:
- Reported performance metrics are gross, not net. Accounting for monthly portfolio turnover and shorting costs would reduce these metrics. Moreover, shorting may not feasible for all stocks specified.
- It is not obvious that all required data is available in a timely enough manner both to compute implied skewness and volatility metrics at the end of the month and to execute portfolio reformation at the same monthly close.
- Using the same data to test several metrics incorporates snooping bias, such that the best-performing metric likely overstates expectations.
- Data acquisition and processing requirements may be difficult/costly for many investors. If delegated to a fund manager, these tasks would incur administrative/management fees.