Does average volatility of individual stock prices, as a measure of market risk, usefully predict stock market behavior? In the June 2010 draft of their paper entitled “Average Stock Variance and Market Returns: Evidence of Time-Varying Predictability at the Daily Frequency”, Jason Chen, Hernán Ortiz-Molina and Stacy Zhang investigate the ability of a daily measure of average stock variance to predict next-day market returns. Using daily market returns, daily returns and market capitalizations for a broad sample of individual stocks and daily yields for Treasury bills spanning 1926-2008, they find that:
- The strength and even the direction of the relationship between average stock variance and future market return vary significantly over short periods of time.
- A strategy that assumes a static relationship between value-weighted average stock variance and next-day value-weighted market return (using inception-to-date, expanding window data) does not profitably time the market. This strategy is in the stock market for the 18,623 out of 21,874 trading days in the sample period for which a static model predicts positive returns.
- However, a rolling window timing strategy (RWTS) employing the last 60 trading days of historical data significantly outperforms a market buy-and-hold strategy on a mean-variance basis.
- RWTS is in the market for 13,779 out of 21,874 trading days in the sample period.
- RWTS has a mean annualized return of 11.4% and a standard deviation of annual returns of 10.9%, with a Sharpe ratio of 0.728 (nearly twice the Sharpe ratio of buy-and-hold).
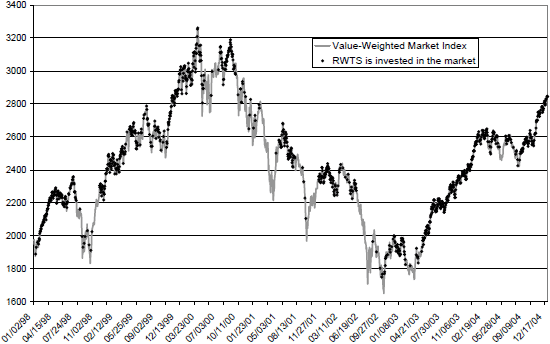
- RWTS enters and exits the stock market over all subperiods, but is less active during bad times when market predictability is relatively strong (see the chart below for a subsample).
The following chart, taken from the paper, plots the daily level of a value-weighted stock market index in light gray over the 1998-2004 subperiod, with dark dots indicating the dates when the above RWTS is invested in the stock market. Results suggest that the strategy tends to avoid large declines and is generally less active during bear markets.

Return calculations for the timing strategies considered apparently ignore trading frictions and are therefore gross rather than net.
In summary, evidence suggests that investors may be able to gain an edge by considering the recent historical relationship between average stock price variance and future short-term market return.