Is beta an effective tool for selecting exchange-traded funds (ETF)? In their October 2010 paper entitled “Black Swans, Beta, Risk, and Return”, Javier Estrada and Maria Vargas investigate the usefulness of beta as a metric for constructing portfolios of country and industry ETFs. They use the MSCI world market index (consisting of developed markets only before 1988 and both developed and emerging markets thereafter) as the beta reference. They calculate beta based on a rolling historical window of the most recent 36-60 months (depending on data availability). They arbitrarily define black swan months as those with a world market index return of at least 5% down or up. Using monthly total returns of MSCI indexes for 47 countries (23 developed and 24 emerging) and 57 industries from the earliest month available for each (1970 for the oldest) through December 2009, they find that:
- As defined, there are 99 (36 negative and 63 positive) black swan months during the relevant period of 1973-2009.
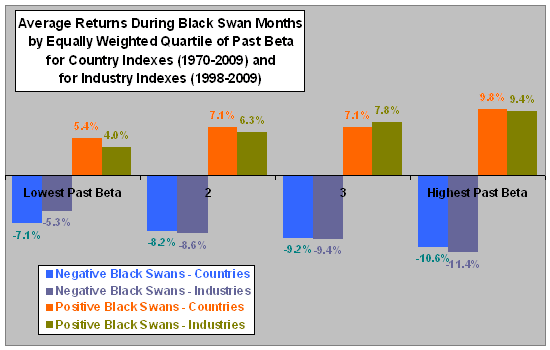
- During negative black swan months, the fourth of country (industry) indexes with the highest past betas underperform the fourth with the lowest past betas by an average 3.5% (6.1%) on an equally weighted basis. Conversely, during positive black swan months, the highest-beta countries (industries) outperform the lowest by an average 4.4% (5.4%). See the first chart below.
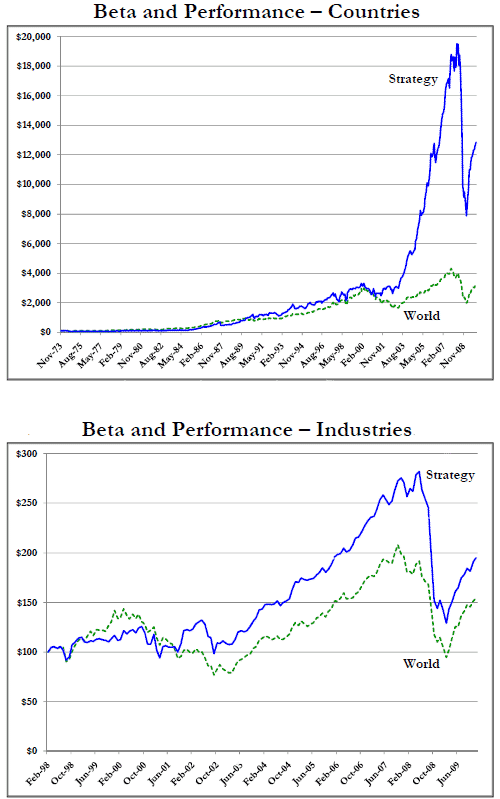
- A mean reversion strategy of investing equally in the fourth of country (industry) indexes with the highest past betas after negative black swan months and the lowest past betas after positive black swan months outperforms a passive investment in the world market by an annualized 4.3% (2.0%) during December 1973 (February 1998) through December 2009. See the second and third charts below.
The following chart, constructed from data in the paper, summarizes average returns during negative and positive black swan months for four portfolios of country indexes and four portfolios of industry indexes separately sorted by past beta just before those months. The sample period for countries (industries) is January 1973 (1998) through December 2009, encompassing 36 (17) negative and 63 (21) positive blacks swan months. The systematic and reasonably large variation of average returns across ranges of past beta indicate that beta effectively gauges ETF responses to dramatic market behavior.

The next two charts plot the cumulative performances of the post-black swan reversion strategy described above as applied to country indexes (November 1973 through December 2009) and industry indexes (February 1998 through December 2009). They also plot for comparison the performance of a passive strategy of buying and holding the world index. Results show that the black swan reversion strategy often, but not always, outperforms buy-and-hold. Note that outperformance of the black swan reversion strategy appears to concentrate in the decade of the 2000s.

The authors note: “Although the portfolios we build and evaluate would have been very costly to assemble during most of our sample period, they are both feasible and cheap to build nowadays. Hence, we believe our results are relevant from a forward-looking perspective.”
In summary, evidence from simple tests of modest samples indicates that beta may be a useful both as a measure of ETF risk and as a tool for ETF portfolio selection.
Reservations about this research include:
- Including costs/fees for constructing and maintaining real portfolios from index components would substantially debit the gross returns estimated above. As noted by the authors, trading frictions were high during most of the sample period.
- As noted above, outperformance of the black swan reversion strategy for ETF portfolio construction appears to derive mostly from the decade of the 2000s, during which many random timing strategies beat the market.
- While the authors believe otherwise, the market may adapt to availability ETFs in ways that diminish the easily identified reversion returns.