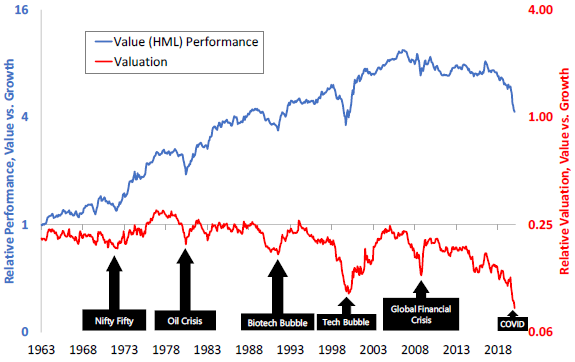
Based on the conventional definition of the value premium, value underperforms growth over last 13.5 years with maximum drawdown of a long value-short growth portfolio -55%. Is value investing dead? In the August 2020 update of their paper entitled “Reports of Value’s Death May Be Greatly Exaggerated”, Robert Arnott, Campbell Harvey, Vitali Kalesnik and Juhani Linnainmaa examine arguments that value investing is dead. They first employ bootstrapping to estimate the likelihood of the recent deep value premium drawdown by resampling 6-month value factor returns 1,000,000 times using the historical sample up to December 2006. They then examine the historical context of recent behaviors of each of three components of the value premium:
- Migration rates of value (growth) stocks toward growth (value) due to mean reversion of the underpinning valuation ratio.
- Relative profitability of value stocks versus growth stocks.
- Relative valuation (average price-to-book value ratio) of value stocks versus growth stocks.
They assess statistically whether these recent behaviors signal temporary deviations or permanent changes in components of the value premium. Using value premium data for July 1963 through June 2020, they find that:
- Bootstrap analysis indicates that the probability of the current -55% drawdown over 13.5 years in the cumulative value premium is 2.3%. This probability is statistically significant, but is biased by exclusion of post-2006 data (to be predictive rather than descriptive).
- However, a value investor is still 4.3 times wealthier than a growth investor over the full July 1963 through June 2020 sample period.
- Differences between pre-2007 and recent migration rates and relative profitability of value stocks and growth stocks are not statistically significant.
- The combined effect of migration and profitability components (structural alpha of value) is just 1.1% per year since 2007, compared to 5.9% pre-2007. The amount of bad luck required to explain the recent underperformance is unexceptional given the historical variability of the value premium.
- However, large capitalization growth profitability is unusually high during the recent subperiod due to six growth stocks with aggregate market capitalization $6.2 trillion.
- Changes in relative valuation drive about two-thirds of the variance in the value premium. Since 2007, change in relative valuation contributes -7.2% annually to value premium, compared to -0.7% pre-2007. In other words, value stocks become much cheaper compared to growth stocks over the last 13.5 years (see the chart below).
- If value stocks remain at their current level of undervaluation relative to growth stocks, modeling suggests that value should in the future beat growth by 4.5% annually. Slight mean reversion to the 95th percentile translates to a 37.1% cumulative return for value stocks. A move to the 50th percentile translates to a 76.8% cumulative return.
- Because of the growing importance of intangible assets, it makes sense to adjust the definition of value by capitalizing investments in intangibles, which would increase the value premium since 1990 by 1% per year (but still has drawdown -41% over the 3.5 years ending June 2020).
The following chart, taken from the paper, tracks evolution of the cumulative value premium (blue line, left axis) and relative valuation of value versus growth (red line, right axis). Notable points are:
- In the short run, changes in relative valuation drive the value premium.
- However, divergence of the two lines suggests that structural alpha (combined effects of migration rates and profitability) drives the premium over the long run.
- The median relative valuation is 0.21, ranging from 0.08 (COVID-19 pandemic) to 0.30 (bursting of Nifty-Fifty bubble).
- Since July 2007, the value premium has annual return -6.2%, with cumulative drawdown -55%. Relative valuation decreases from 0.23 (25th percentile) to 0.08 (the cheapest ever). At the end of this subperiod, growth stock average price-to-book value ratio is about 12 times that for value stocks. This change in relative valuation contributes -7.2% to annual return and overwhelms contemporaneous annual 1.1% structural alpha.

In summary, recent evidence against value investing, driven by exceptional widening of the valuation spread between value and growth stocks, is not strong enough to declare its death. Assuming this spread will not continue to widen, value is poised to beat growth.
Cautions regarding findings include:
- Reported results are gross, not net. Accounting for annual rebalancing frictions and continuous shorting costs/constraints for the value premium portfolio would reduce all returns. Moreover:
- Since such costs may differ for value and growth stocks, net findings could differ from gross findings.
- Investors generally access the value premium via funds that charge administrative and management fees.
- Findings imply that standalone value premium exploitation requires a very long investment horizon and tolerance for substantial drawdowns.