Are valuation metrics for Real Estate Investment Trusts (REIT) useful indicators of future returns? In his June 2012 paper entitled “Modern Portfolio Theory as Applied to REITs”, Jeffrey Kerrigan evaluates the value premium among REITs. At the end of each month, he reforms equally weighted portfolios of the fifths (quintiles) of REIT stocks with the highest and lowest book-to-market price ratios and calculates the returns of these portfolios over the next month. He estimates the REIT value premium based on the difference in performance between these two portfolios. Using monthly returns for 93 REITs as available during December 1995 through March 2012, he finds that:
- Over the entire sample period, the compound annual gross return of the quintile portfolio with the highest (lowest) prior-month book-to-market ratio is 18.2% (1.9%), with standard deviation of annual returns 22.6% (24.2%). The compound annual gross value premium is 15.7%, with standard deviation of annual premiums 4.5%.
- Constraining portfolios to less than 1% of market capitalization and less than 50% of average daily volume for each REIT indicates an exploitation capacity of about $250 million ($1 billion) for a long-short (long-only) strategy.
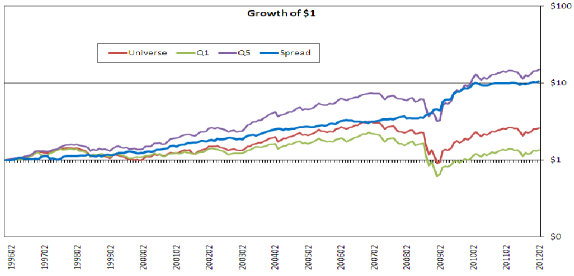
The following chart, taken from the paper, shows cumulative gross values over the sample period of $1 initial investments in: (1) an equally weighted portfolio of all REITs in the sample (Universe); (2) the quintile portfolio with the lowest prior-month book-to-market ratios (Q1); (2) the quintile portfolio with the highest prior-month book-to-market ratios (Q5); and, (4) a hedge portfolio that is long Q5 and short Q1. Terminal values are $2.64, $1.36, $15.01 and $10.62, respectively. Hedge portfolio returns are the least volatile.
The 2008 financial crisis contributes substantially to the gross value premium.

In summary, evidence indicates that REITs with high book-to-market ratios tend to outperform those with low book-to-market ratios consistently at a gross level.
Cautions regarding findings include:
- As noted in the paper, calculations ignore trading frictions and shorting costs (and shorting feasibility). Trading frictions are likely highest for small REITs.
- In correspondence, the author clarified that:
- Equity REIT and mortgage REIT quintile rankings are separate because of their different capital structures and hence book-to-market ratio ranges.
- “Cheap” REITs tend to be small, limiting exploitability, and suggesting that the estimated gross value premium may be a liquidity premium.
- There is not enough information in the paper to interpret the second table (which has errors) and associated chart.
- Regarding the threshold of 50% of daily volume as a determinant of strategy capacity, it is arguable that adding such an incremental volume of buying or selling pressure during rebalancing would substantially impact stock price, materially elevating trading frictions and thereby reducing the net value premium.