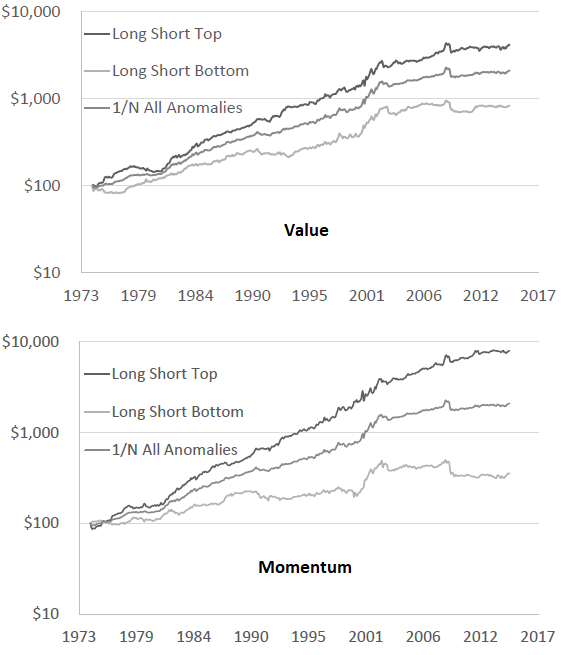
Do stock anomaly (factor premium) portfolios exhibit exploitable value and momentum? In their February 2020 paper entitled “Value and Momentum in Anomalies”, Deniz Anginer, Sugata Ray, Nejat Seyhun and Luqi Xu investigate exploitability of time variation in the predictive ability of 13 published U.S. stock accounting and price-based anomalies based on: (1) anomaly momentum (1-month premiums); and/or (2) anomaly value (adjusted average book-to-market ratios). Specifically, they each month:
- For each anomaly, form a value-weighted portfolio that is long (short) the tenth, or decile, of stocks with the highest (lowest) expected returns.
- For each long-short anomaly portfolio:
- Measure its value as last-year average book-to-market ratio minus its average of average book-to-market ratios over the previous five years.
- Measure its momentum as last-month return.
- Form a value portfolio of anomaly portfolios that holds the equal-weighted top seven based on value, rebalanced annually.
- Form a momentum portfolio of anomaly portfolios that holds the equal-weighted top seven based on momentum, rebalanced monthly.
- Form a combined value-momentum portfolio of anomaly portfolios that holds those in the top seven of both value and momentum, equal-weighted and rebalanced monthly.
Their benchmark is the equal-weighted, monthly rebalanced portfolio of all anomaly portfolios (1/N). Using data required to construct anomaly portfolios and monthly delisting-adjusted returns for U.S. common stocks excluding financial stocks and stocks priced under $1 during January 1975 through December 2014, they find that:
- There is significant persistence in rankings of anomalies based on specified value and momentum metrics.
- Average monthly gross excess returns and 3-factor (adjusting for market, size and book-to-market factors) alphas are (see the charts below):
- For the value portfolio of top seven (bottom six) anomaly portfolios, 0.82% and 0.88% (0.47% and 0.65%), respectively. Annualized gross Sharpe ratio for the top seven is 1.00, with maximum drawdown -22%.
- For the momentum portfolio of top seven (bottom six) anomaly portfolios, 0.96% and 1.06% (0.30% and 0.44%), respectively. Annualized gross Sharpe ratio for the top seven is 1.10, with maximum drawdown -22%.
- For the combined value-momentum portfolio of top (bottom) anomaly portfolios, 1.08% and 1.15% (0.11% and 0.29%), respectively.
- For the 1/N benchmark, 0.66% and 0.78%, respectively. Annualized gross Sharpe ratio is 1.06, with maximum drawdown -23%.
- Similar to relative momentum and value, there are intrinsic (absolute or time series) momentum and value effects that are modestly stronger than relative effects.
The following two charts, taken from the paper, each depict gross cumulative performances over the full sample period of $100 initial investments in:
- Long Short Top – holds the top seven anomaly portfolios based on value (upper chart) or momentum (lower chart).
- Long Short Bottom – holds the bottom six anomaly portfolios based on value or momentum.
- 1/N All Anomalies – holds all anomaly portfolios, weighted equally and rebalanced monthly.
Notable points are:
- Anomaly portfolios exhibit both relative value and relative momentum effects based on gross returns.
- Outperformances of high-value and high-momentum anomaly portfolios are fairly steady.
- The momentum gross effect is stronger than that for value, but frictions for monthly versus annual rebalancing may offset on a net basis.

In summary, evidence indicates that well-known stock return anomalies exhibit potentially exploitable value and momentum behaviors.
Cautions regarding findings include:
- Data, ending with 2014, are somewhat stale.
- Reported returns are gross, not net. Accounting for trading frictions from periodic anomaly portfolio reformation and shorting costs would reduce all returns. Moreover:
- Shorting may not always be feasible as assumed due to lack of shares to borrow.
- Since frictions and shorting costs may vary by anomaly, ranking of stocks based on momentum may differ for gross and net returns.
- Annualized gross Sharpe ratios and maximum drawdowns of value and momentum approaches offer little or no improvement over the 1/N benchmark.
- Methods described are beyond the reach of most investors, who would bear fees for delegating to a fund manager.
- There may be data snooping bias in anomaly portfolio value and momentum specifications, such that outcomes overstate expectations. There may also be inherited snooping bias in prior anomaly research.
For some recent related research, see: