Why do recent studies find that the value premium declines over time? In their April 2020 paper entitled “The Fundamental-to-Market Ratio and the Value Premium Decline”, Andrei Gonçalves and Gregory Leonard investigate whether book value (book equity, BE) is a good proxy for actual fundamental value (fundamental equity, FE). They measure FE for each firm at the end of June from accounting data as of the end of the prior calendar year as autoregression-estimated cash flow (payouts, including share buybacks) with a uniform discount rate across firms. They then sort stocks into tenths (deciles) based on BE-to-Market Equity ratio (BE/ME) or FE-to-Market Equity ratio (FE/ME) based on end-of-June stock prices. Finally, they annually reform capitalization-weighted portfolios that are long (short) the deciles with the highest (lowest) ratios to compare BE-based and FE-based value premiums. Using BE and FE inputs, market capitalizations and prices for all U.S.-listed common stocks except utilities and financials during July 1973 through June 2019, they find that:
- The correlation between BE/ME and FE/ME across stocks decreases from 0.67 in the first half of the sample period to 0.26 in the second half.
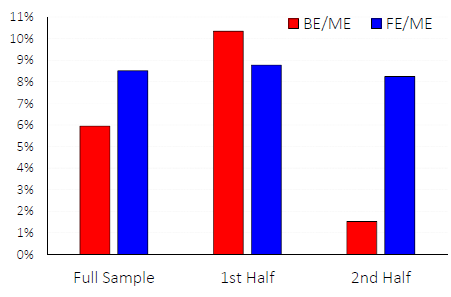
- The average gross annual value premiums based on FE/ME (BE/ME) are [see the chart below]:
- 8.5% (5.9%) for the full sample.
- 8.8% (10.3%) for the first half of the sample.
- 8.5% (1.5%) for the second half of the sample.
- 6.9% (1.6%) among the largest firms.
- The FE/ME-based value premium is more persistent than that for BE/ME over holding periods longer than one year.
- The BE/ME-based premium disappears after controlling for the correlation
between BE/ME and FE/ME. - Widely used multifactor models of stock returns fail to capture the FE/ME-based value premium.
The following chart, taken from the paper, compares average gross annual value premiums calculated with BE/ME and FE/ME over the full sample period and the first (1973-1995) and second (1996-2018) halves of the sample period. The former premium almost disappears over time, while the latter is steady.

In summary, evidence indicates that the conventional value premium declines because BE is no longer a good measure of expected cash flow. A broader measure of expected cash flow works well.
Cautions regarding findings include:
- Portfolio performance statistics are gross, not net. Accounting for annual portfolio reformation frictions and continuous shorting costs would reduce returns. Shorting may not always be feasible as specified due to lack of shares to borrow.
- The FE estimation method and the portfolio formation approach are beyond the reach of most investors, who would bear fees for delegating this work to a fund manager.
- Testing different stock ranking measures on the same sample introduces data snooping bias, such that the best-performing measure overstates expectations.