Do industries exhibit the market beta, value and momentum anomalies overall and in recent data? In his August 2012 paper entitled “The Failure of the Capital Asset Pricing Model (CAPM): An Update and Discussion”, Graham Bornholt examines the beta, value and momentum anomalies using returns for 48 U.S. industries. Each month, he forms three groups of eight equally weighted portfolios of industries ranked separately by: (1) beta based on rolling regressions of industry returns versus value-weighted market returns over the past 60 months; (2) value based on the latest available industry book-to-market ratios (value-weighted composites of component firm book-to-market ratios, updated annually); and, momentum based on lagged six-month industry returns. There are therefore six industries in each portfolio. Using monthly industry returns from Kenneth French’s website, monthly returns for the value-weighted U.S. stock market in excess of the one-month U.S. Treasury bill yield, and industry component book-to-market ratios during July 1963 through December 2009 he finds that:
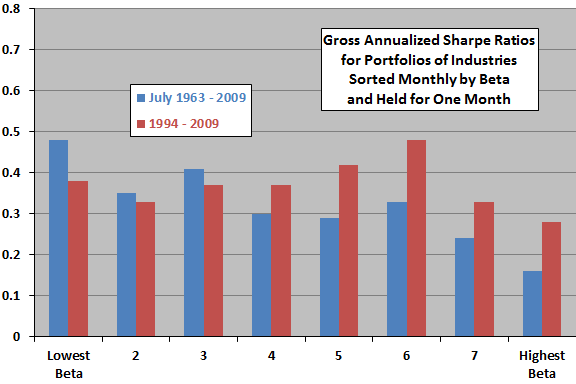
- For portfolios of industries sorted monthly on lagged beta and held for one month (see the first chart below):
- Over the entire sample period, the lowest-beta portfolio (gross annualized Sharpe ratio 0.48) outperforms the highest-beta portfolio (gross annualized Sharpe ratio 0.18) by a gross average annualized 2.8%.
- Over the recent 1994-2009 subperiod, the lowest-beta portfolio (gross annualized Sharpe ratio 0.38) underperforms the highest-beta portfolio (gross annualized Sharpe ratio 0.28) by a gross average annualized 2.6%.
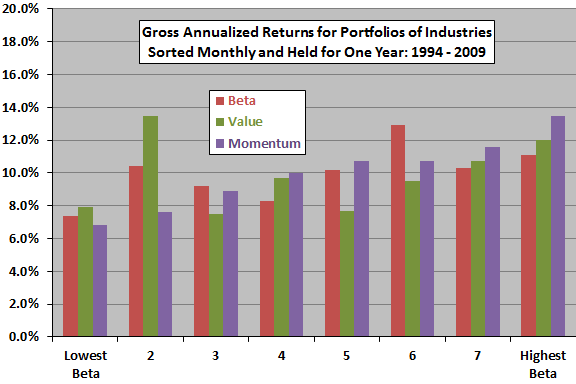
- For portfolios of industries sorted monthly on lagged beta, value and momentum and held for one year (see the second chart below):
- The lowest-beta portfolio outperforms (underperforms) the highest-beta portfolio by a gross average 1.9% (3.7%) per year during July 1963-2009 (1994-2009).
- The highest-value portfolio outperforms (outperforms) the lowest-value portfolio by a gross average 3.4% (4.1%) per year during July 1963-2009 (1994-2009).
- The highest-momentum portfolio outperforms (outperforms) the lowest-momentum portfolio by a gross average 7.6% (6.8%) per year during July 1963-2009 (1994-2009).
The following chart, constructed from data in the paper, summarizes gross annualized Sharpe ratios of eight portfolios (octiles) reformed monthly from sorts of 48 U.S. industries on lagged beta and held for one month during July 1963 through 2009 and during 1994 through 2009. Results indicate weakening of the low-beta anomaly as applied to industries in recent data.
In the recent subperiod, the poor performance of octiles 7 and 8 derives from high volatility, not low returns.

The next chart, also constructed from data in the paper, summarizes gross annualized returns of eight portfolios reformed monthly from sorts of 48 U.S. industries on lagged beta, value and momentum and held for one year during 1994 through 2009. Results suggest that:
- The beta anomaly as applied to industries is non-existent (or even reversed) in recent data.
- The value anomaly may exist, but exhibits inconsistencies.
- The momentum anomaly is relatively strong and systematic.
Results do not take into account differences in octile portfolio volatilities. The momentum portfolios likely generate greater turnover (and higher trading frictions) than beta and value portfolios.

In summary, evidence suggests that a low-beta strategy as applied to industries is unattractive in recent data, while the value and (especially) the momentum anomaly may be exploitable.
Cautions regarding findings include:
- The recent subperiod is short (16 years) for testing one-year holding intervals.
- Performance metrics are gross, not net. Incorporating reasonable trading frictions would reduce reported values. As noted, the most attractive anomaly (momentum) likely has the highest turnover and trading frictions.
- Industry portfolios are effectively indexes, not tradable assets. Incorporating the costs of creating and maintaining tradable funds as proxies for these indexes would reduce performance.
For a simple momentum strategy implemented with tradable U.S. stock sector exchange-traded funds (ETF), see “Simple Sector ETF Momentum Strategy” and associated research summaries.