How do the technical trading rules that work best in a past study perform for new data? In the March 2012 version of their paper entitled “Predictability of the Simple Technical Trading Rules: An Out-of-Sample Test”, Jiali Fang, Ben Jacobsen and Yafeng Qin re-test performances of the 26 best technical trading rules from a 20-year old study with new data. This true out-of-sample approach avoids biases arguably endemic in retrospective testing. The selected 26 trading rules are those that perform best as applied to the Dow Jones Industrial Average (DJIA) during 1897 through 1986. These best rules are reasonably representative of rules applied in practice, comprising three groups: variable-holding interval moving average rules; fixed-holding interval moving average rules; and, trading range breakout rules. Analysis assumes long and short positions according to buy and sell signals (not long and cash). Using daily closes for DJIA during January 1987 through March 2011 and during February 1885 through December 1896, and for the S&P 500 Composite Index during January 1987 through March 2011, they find that:
- Overall, there is little or no evidence from 1987- 2011 DJIA data supporting belief in the continued effectiveness of the 26 best technical trading rules from 1897-1986. In fact, returns for most sell signals in the new data are positive.
- Removing the post-2008 financial crisis subperiod does not affect this conclusion.
- Nor does evidence from 1987-2011 S&P 500 Composite Index data or 1885-1895 DJIA data support belief in effectiveness of these 26 trading rules.
- The 1897-1986 profitability of these rules does not gradually attenuate after 1986 but rather disappears abruptly in the new data, indicating that sample bias rather than increasing market efficiency is the likely explanation of the past effectiveness.
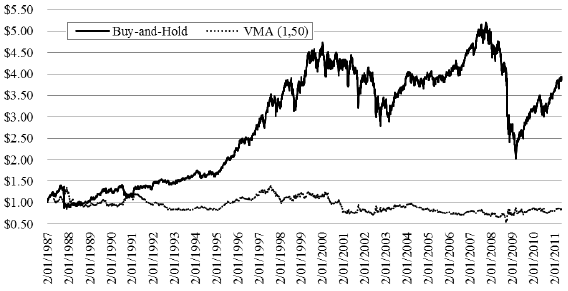
The following chart, taken from the paper, compares the cumulative value of $1.00 initial investments in an 1897-1986 “best” technical trading rule, the (1, 50) variable-holding interval moving average rule, and a buy-and-hold approach using 1987-2011 DJIA data. This rule is long (short) when the daily DJIA close is above (below) the 50-day moving average. Terminal values at the end of March 2011 are $0.85 for the (1, 50) trading rule and $3.87 for buy-and-hold. The cumulative value of the trading rule ranges between $0.55 and $1.41, seldom outperforming the market.
Results for the other 25 1897-1986 “best” trading rules are similar.

In summary, evidence from true out-of-sample tests on the best technical trading rules from 1897-1986 indicates that testing biases are the source of their past outperformance.
Cautions regarding findings include:
- Returns are gross, not net. Including reasonable trading frictions, which vary considerably over the sample period, would reduce reported technical trading rule returns depending on number of trades (to the advantage of buying and holding the index).
- Shorting costs would also reduce reported returns while on sell signals.
- Testing on indexes rather than tradable assets ignores the costs (trading frictions and management fees) involved in establishing and maintaining actual portfolios.