Does simple asset price trend following based on 10-month simple moving average (SMA10) reliably boost the performance of retirement portfolios? In their July 2017 paper entitled “Can Sustainable Withdrawal Rates Be Enhanced by Trend Following?”, Andrew Clare, James Seaton, Peter Smith and Steve Thomas compare effects of asset class diversification and trend following on safe withdrawal rates from UK retirement portfolios. They consider 60-40 UK stocks-bonds, 30-70 UK stocks-bonds and equally weighted UK stocks, global stocks, bonds, commodities and UK real estate (EW Multi-asset). They further consider risk parity (RP) multi-asset (each class weighted by the inverse of its prior-year volatility) and 100% global stocks (equally weighted across five regions). They focus on a 20-year retirement period (but also consider 30-year), assume annual withdrawals the first day of each year and ignore taxes and rebalancing frictions. They use both in-sequence historical asset returns and Monte Carlo simulations (random draws with replacement from the historical annual returns of each portfolio). They apply trend following separately to each asset by holding the asset (cash) when asset price is above (below) its SMA10. Their key portfolio performance metric is Perfect Withdrawal Rate (PWR), the constant real (inflation-adjusted) withdrawal rate as a percentage of initial portfolio value that exactly exhausts the portfolio at the end of the retirement period. Using monthly total returns in pounds sterling for the selected asset classes and values of the UK consumer price index during 1970 through 2015, they find that:
- Multi-asset portfolios moderately outperform UK stocks-bonds portfolios, and SMA10 trend following substantially boosts performance of all portfolios (see the chart below). In general, SMA10 trend following works by reducing volatility and maximum drawdown (MaxDD) without reducing average return.
- PWRs for trend following portfolios are therefore much less variable across retirement start dates, essentially by eliminating the lowest PWRs (worst retirement outcomes) of non-trend following portfolios without much reduction in the chance of high PWRs. In other words, trend following suppresses the left tail of the outcome distribution much more than the right tail.
- Viewed differently, retirement portfolios with SMA10 trend following accommodate higher weights for risky assets at the same volatilities and much less severe MaxDDs than similar portfolios without trend following.
- The trend following version of the basic 60-40 allocation is a simple, excellent retirement portfolio.
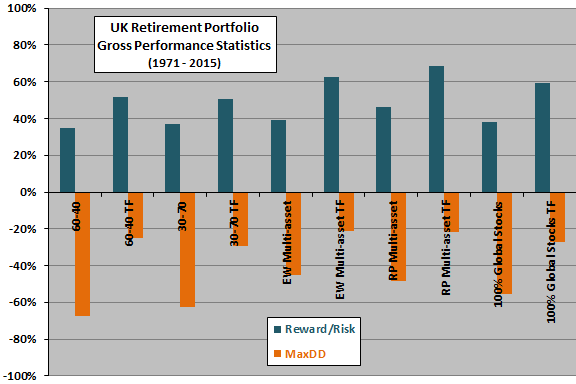
The following chart, constructed from data in the paper, compares real reward/risk (annualized average real return divided by annualized real return volatility) and maximum drawdown (MaxDD) without and with an SMA10 trend following overlay (TF) for the following five UK portfolios, all rebalanced monthly:
- 60-40 – 60% allocation to UK stocks and 40% allocation to UK bonds.
- 30-70 – 30% allocation to UK stocks and 70% allocation to UK bonds.
- EW Multi-asset – 20% allocations to each of UK stocks, global stocks, bonds, commodities and UK real estate.
- RP Multi-asset – inverse volatility allocations (scaled linearly to total 100%) to each of UK stocks, global stocks, bonds, commodities and UK real estate.
- 100% Global Stocks – 20% allocations to each of five global regions.
Results indicate that: (1) diversification to five asset classes moderately improves reward/risk and suppresses MaxDD compared to two assets; and, (2) SMA10 trend following consistently and strongly boosts reward/risk and suppresses MaxDD.

In summary, evidence indicates that UK retirees should prefer multi-asset portfolios to simpler stocks-bonds portfolios and that trend following substantially reduces the probability of retirement portfolio exhaustion with little risk of missing the best outcomes.
Cautions regarding findings include:
- The historical sample is very short in terms of number of independent retirement periods (only about two 20-year periods), undermining confidence in representativeness of findings.
- Returns are gross, not net. Accounting for monthly rebalancing frictions would reduce reported returns. Since these frictions may vary by portfolio, relative attractiveness may differ for net performance data.
- The choice of SMA10 for trend following may inherit data snooping bias from prior research, thereby overstating performance expectations.
- As noted in the paper, PWR can be known only retrospectively but still allows comparison of investment strategies. PWR overstates the withdrawal rate that a conservative investor, or an investor desiring to leave a legacy, would choose.
See also: