Reversion-to-trend appears to hold in many financial markets. Is this concept exploitable for country stock markets? In their June 2013 paper entitled “Do ‘Dogs of the World’ Bark or Bite? Evaluating a Mean-Reversion-Based Investment Strategy”, David Smith and Vladimir Pantilei test a simple “Dogs of the World” strategy designed to exploit long-term reversion across the 45 developed and emerging country stock markets comprising the MSCI All Country World Index (ACWI). Specifically, at the end of year one of their sample period, they allocate one fifth of initial funds equally to the five country stock markets with the lowest returns that year and hold for five years. At the ends of each of years two, three, four and five, they similarly allocate one fifth of initial funds to the five worst-performing markets that year to become fully invested. At the end of each subsequent year, they replace the oldest portfolio holdings with the five equally weighted worst performers that year. The MSCI ACWI (MSCI Developed Markets Index) is the benchmark since its inception in 1988 (before 1988). All returns are in U.S. dollars. They focus on a long test with indexes but also conduct a shorter, more realistic test with exchange-traded funds (ETF) that track country stock markets (at the lowest available cost). Using monthly returns for 45 country stock market indexes as available since 1970 (most begin in the 1980s and 1990s) and for corresponding ETFs as available since 1996 (many are much younger) through 2012, they find that:
- Return regressions generally support some belief in index reversion at a five-year horizon, though conventional statistical significance is rare.
- For country stock market indexes since 1971:
- The gross annual arithmetic (geometric) mean return for the “Dogs of the World” strategy is 14.3% (10.4%), compared to 11.2% (9.4%) for the benchmark. The strategy is very volatile, with standard deviation of annual returns 30.1% (compared to 18.6% for the benchmark), so its gross annual Sharpe ratio of 0.31 is lower than the 0.32 for the benchmark.
- Tests for holding periods of one to five years and holdings of one to five of the worst performers over the past year suggest that: (1) two-year and four-year holding intervals are best; and, (2) strategy returns and volatility both increase as the number of holdings decreases.
- For country stock market ETFs since 1997, the gross annual arithmetic (geometric) mean return for the “Dogs of the World” strategy is 11.0% (7.5%), compared to 7.4% (5.1%) for the benchmark. The strategy is again volatile, with standard deviation of annual returns 27.1% (compared to 21.5% for the benchmark), but its gross annual Sharpe ratio of 0.31 is higher than the 0.22 for the benchmark.
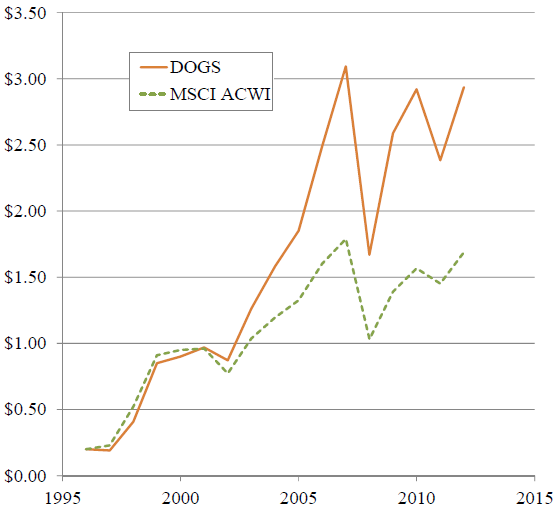
The following chart, taken from the paper, compares the gross cumulative values of $1 initial investments in the “Dogs of the World” strategy as described above and the MSCI ACWI benchmark during 1997 through 2012. Terminal values are $2.94 for the active strategy and $1.69 for the benchmark. The chart shows the very high volatility of the strategy, but some of the volatility is upside. The chart also shows that there are fairly long subperiods during which the strategy does not outperform the benchmark.

In summary, evidence suggests that systematically investing in the country stock markets with the worst returns over the past year and holding for several years may generate higher gross average and cumulative returns than buying and holding the world equity market (but with high volatility).
- As noted repeatedly in the paper, the “Dogs of the World” strategy is very volatile.
- Sample periods are short for a strategy that trades annually with five-year holding periods (only about eight independent five-year intervals for indexes and three for ETFs, and fewer for many country markets).
- As noted in the paper, use of indexes ignores the trading frictions and management/administrative costs of constructing and maintaining tradable assets. This approach overstates reasonably achievable returns for both individual country indexes and composite benchmarks and may vary considerably across country markets.
- For both indexes and ETFs, the paper ignores the trading frictions (transaction fees, bid-ask spreads and potentially impact of trading) involved in annual buying and selling. These costs would generally reduce performance and vary over time (much higher early in the index sample period). Spreads and impact of trading may differ materially by market due to differences in liquidity, and the worst-performing markets may tend to be the least liquid.