Can investors effectively exploit the short-term price reversal anomaly for individual stocks after trading friction? Is success limited to big players? In their May 2010 paper entitled “Another Look at Trading Costs and Short-Term Reversal Profits”, Wilma de Groot, Joop Huij and Weili Zhou investigate the net profitability of reversal trading with and without steps to suppress trading friction. Using market capitalization, return and trading data for a broad sample of U.S. stocks spanning 1990-2009, and two models of contemporaneous associated trading friction, they conclude that:
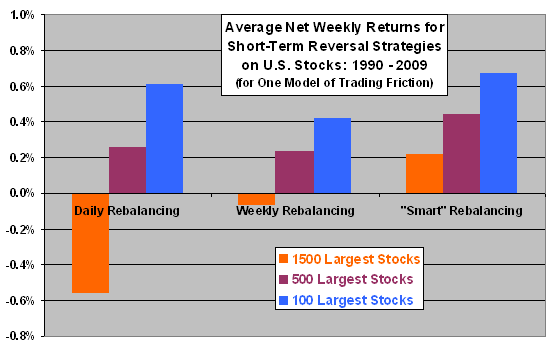
- The impact of trading friction on reversal strategy net profitability derives largely from frequent trading of small capitalization stocks (see the chart below).
- A hedge portfolio that is long (short) the tenth of the 1,500 largest U.S. stocks with the lowest (highest) one-week returns, rebalanced daily with a skip-day, generates an average gross weekly gain of 0.9% over the sample period. However, reasonable trading friction flips this result to a net weekly loss.
- Weekly rebalancing (rather than daily) reduces trading friction but degrades gross reversal returns.
- Limiting the strategy to the 500 (100) largest capitalization stocks generates an average weekly net return of about 0.2% (0.6%).
- Adjusting hedge portfolio construction to reduce strategy turnover by waiting to sell (buy back) stocks that are no longer losers (winners) until they rank among the top (bottom) half of past weekly returns boosts average weekly net return to about 0.4% (0.7%) for the 500 (100) largest capitalization stocks.
- Results generally hold for industries and for the pre-decimalization subperiod.
The following chart, constructed from data in the paper, summarizes the average net daily returns during 1990-2009 of short-term reversal strategies for three rebalancing approaches and three ranges of stock capitalizations (for the more contemporary of two models of trading friction). Results suggest that net profitability comes from large capitalization stocks (because of low trading friction).

Note that:
- The study models trading friction assuming large trade sizes (~$1 million), such that results are likely inapplicable to the typical individual investor. Access to these profits for such an investor would entail management/performance fees from a fund.
- The study apparently models trading friction assuming a single large trader executing the strategy. Many such traders acting on similar rules may induce disruptive market adaptations.
- Testing of multiple strategies on the same data set may introduce material data snooping bias.
In summary, large investors may be able to exploit short-term reversals in individual stock returns by focusing on large capitalization stocks and rebalancing based on return analysis rather than fixed interval.