A reader requested: “Please analyze The Mutual Fund Strategist, written by Holly Hooper-Fournier. They seem to have done quite well.” While the web site for this newsletter does not explicitly describe its timing method, it does explain that: “All of our timing models are oriented towards the intermediate trend…a period between several weeks and several months in duration. Focusing on the intermediate trend allows us to control risk effectively without subjecting your invested capital to the wide price swings that are associated with major trend following systems, such as a 200-day moving average.” The newsletter makes publicly available a record of “MFStrategist US Growth” timing signals since 2/16/01, as verified by TimerTrac.com. Using these 48 signals, daily dividend-adjusted closing prices for S&P 500 SPDR (SPY) and the daily short-term Interest Rate Composite over the period May 2000 through March 2010, we find that:
We test the timing signals of The Mutual Fund Strategist (MFS) by using them to switch between SPY and cash, with results compared to two simple benchmarks: (1) buy and hold SPY; and, (2) hold SPY (cash) when SPY is above (below) its 200-day simple moving average (SMA). Assumptions are:
- Each strategy starts with $10,000.
- When in cash, a strategy earns the short-term Interest Rate Composite.
- If the MFS signal comes before (after) 16:00, switch at the close on the same (next) day.
- For the 200-day SMA benchmark strategy, anticipation allows switching at the close on the same day SPY crosses its 200-day SMA.
- One-way switching friction is 0.125% of the current balance.
- The monthly MFS fee is $17, charged the last trading day of each month.
- Positions are in place on 2/16/01 (no start-up switching friction).
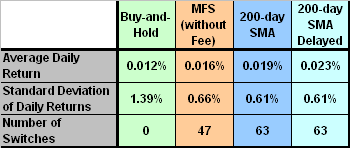
Based on these assumptions the MFS strategy (200-day SMA benchmark strategy) generates 47 (63) switches.
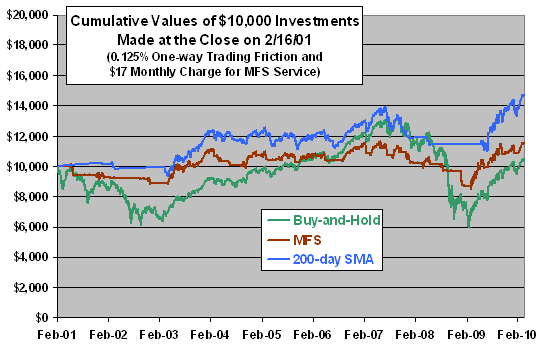
The following chart shows cumulative values of $10,000 investments made at the close on 2/16/01 for the MFS timing strategy and the two benchmark strategies. The benchmark strategy that trades based on the 200-day SMA wins at nearly all times during the test period. Notable points are:
- The effect of the monthly fee for the MFS service is material at this level of investment, roughly equivalent to 110 extra switches.
- Delaying the 200-day SMA switches by one trading day (in case the assumed anticipation of signals is impractical) improves the performance of the 200-day SMA benchmark strategy, boosting terminal value from from $14,703 to $16,098.
- For one-way trading frictions above 0.31%, the terminal value of the buy-and-hold benchmark strategy exceeds that of the MFS strategy.
For a different perspective we look at daily returns.

The following table summarizes the average daily returns, the standard deviations of daily returns and the number of switches for the MFS strategy (without monthly fee) and both benchmark strategies. MFS timing signals improve upon buy-and-hold both by boosting average daily return and suppressing volatility. The 200-day SMA timing signals, whether anticipated or delayed, offer further improvements in both statistics.

Note that the decade 2000-2009 was exceptionally weak for U.S. equities, with “the average Monthly Coin Flipper beat the market by 29% on a [gross] cumulative return basis.” (See “The 2000s: A Market Timer’s Decade?”) Long-run data suggests that results for timing strategies during this decade are unrepresentative.
In summary, evidence from simple tests does not support a belief that The Mutual Fund Strategist timing signals beat simple free timing signals based on a 200-day simple moving average.
In a 4/20/10 email, Mutual Fund Strategist’s editor, Holly Hooper-Fournier, commented:
“To evaluate Mutual Fund Strategist’s timing signals for the U.S. stock market, visit TimerTrac.com via this link. Next click ‘Graphs’ in the left-hand navigation, then select ‘MFStrategist US Growth.’ Choose the ‘Custom’ period of 2/16/01 to the present. The results are delayed by 15 days, but demonstrate that our strategy outperformed the S&P 500 Index over this tumultuous stock market period.”
Response:
The review above, based on these same MFS timing signals, does not disagree with this comment. Note that TimerTrac.com offers return on cash options. Additionally selecting “T-Bill 90” makes the TimerTrac.com graph most comparable to MFS graph in the above review. Disparities between the cumulative return chart thus generated in TimerTrac.com and the MFS graph above are likely due to the following differences in assumptions:
- The TimerTrac.com graph apparently does not include trading frictions for position switches, while the MFS graph above does.
- The TimerTrac.com graph apparently does not include the MFS service fee, while the MFS graph above does.
Note that MFS timing signals specifically for the S&P 500 Index are publicly available on TimerTrac.com, but only since late 2006, too recent for a good test. However, the dates of timing signals for “MFStrategist US Growth” and “MFStrategist S&P 500 Index” are very similar since introduction of the latter (16 of 22 switches on the same date, with differences for the other six switches varying from one to ten trading days).