Do crypto-asset trading volumes usefully predict returns? In the August 2018 draft of their paper entitled “Trading Volume in Cryptocurrency Markets”, Daniele Bianchi and Alexander Dickerson investigate the power of crypto-asset trading volumes to predict future returns. They calculate volumes and returns based on either 12-hour or 24-hour intervals. They process these inputs as follows:
- To detect volume abnormalities, they estimate its log deviation from trend over a rolling 21-interval window. To put different crypto-assets on an equal footing, they then standardized by dividing by its log standard deviation over the same window.
- They measure past returns over the same interval, denominated in bitcoins, (thereby including Bitcoin only indirectly). To emphasize the most liquid exchanges, they weight returns by volume when aggregating.
To assess economic significance of findings, they double-sort crypto-assets first into two to four groups ranked by the return metric and then within each group into three or four subgroups ranked by the volume metric. Using intraday (10-minute) price and volume data for 26 crypto-assets from over 150 exchanges (90% of total crypto-asset market capitalization), each denominated in bitcoins, during January 1, 2017 through May 10, 2018, they find that:
- Volume concentrates in Ethereum, Ripple and Litecoin and is both very volatile and quite persistent, with average interval-to-interval autocorrelation about 0.70.
- Average daily returns are much higher than median returns. Return volatilities are much higher than average returns. There is no autocorrelation in daily returns.
- The interaction between abnormal (shocks to) volume and past returns predicts future returns, both in time series of individual crypto-assets and in the cross-section.
- Findings are consistent for 12-hour and 24-hour measurement intervals and are robust to controlling for past returns, illiquidity and volatility.
- However, volume on its own has little predictive power.
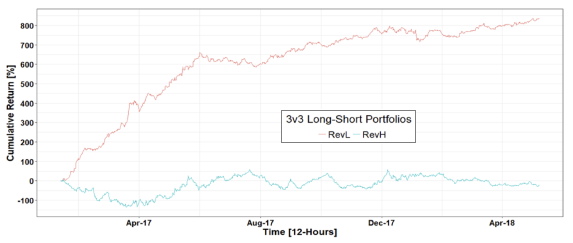
- Such predictive power is economically significant, especially for 12-hour measurement intervals (see the chart below).
- A reversal strategy that is each interval long (short) crypto-assets with low returns and low volumes (high returns and low volumes) in the last interval generates gross annualized Sharpe ratios as high as 2.96.
- This strategy has nearly zero correlation with bitcoin dollar returns and performs well during the recent crypto-asset market crash.
- Results are robust to the number of double-sorted portfolios and are qualitatively similar using 36, 63 and 120 rolling windows for abnormal volatility detection and past return calculation.
- Neither momentum nor volatility factors explain performance of the reversal strategy.
The following chart, taken from the paper, shows gross cumulative returns (in bitcoins) of two portfolios reformed every 12-hour interval from sorting 26 crypto-assets first into three groups ranked by prior-interval return metric and then within each group into three subgroups (3v3) ranked by prior-interval volume metric:
- RevL portfolio – long (short) the subgroup of crypto-assets with the lowest (highest) past return metrics and lowest (lowest) past volume metrics.
- RevH portfolio – long (short) the subgroup of crypto-assets with the highest (highest) past return metrics and lowest (highest) past volume metrics.
Results show that RevL, arguably involving many fewer noise traders, markedly outperforms ReH. However, outperformance concentrates in the first few months of the sample period.

In summary, evidence indicates intraday/daily crypto-asset return reversals following intervals of low volume (low levels of noise trading).
Cautions regarding findings include:
- The sample period is very short compared to the length of the rolling window used to calculate past return and volume metrics.
- Findings are gross, not net. Crypto-asset portfolio reformation may be costly.
- As noted, strategy outperformance concentrates in a relatively small part of the sample period.
- Required data inputs may not be available in a timely enough manner to support the strategy tested. Also, crypto-asset exchanges may not offer timely execution of portfolio reformation trades.
- Exchanges may not have the capacity to support large trades in many of the crypto-assets considered.
- It is not obvious that basing crypto-asset valuations on Bitcoin (taking the viewpoint of a Bitcoin investor) is meaningful for most investors. For example, a Sharpe ratio of 2.96 in bitcoins may not be 2.96 in dollars.
- Considering multiple return/volume metric rolling window lengths, different rebalancing frequencies and different sorting granularities introduces data snooping bias, such that the best-performing combinations overstate expectations (perhaps substantially so in this study).