What are the parameters of profitable stock pairs trading in European equity markets? In their June 2011 paper entitled “European Equity Pairs Trading: The Effect of Data Frequency on Risk and Return”, Michael Lucey and Don Walshe examine the effects of both price measurement frequency (daily, weekly or monthly) and magnitude of pair price divergence on the profitability of European stock pairs trading. In selecting and tracking stock pairs, they use normalized stock prices (current price minus two-year lagged average price divided by standard deviation of lagged prices). They first pair each stock with another exhibiting minimum total squared normalized price difference over the past two years. They then track pairs for normalized price divergence over the next six months. Whenever the divergence of a pair exceeds a threshold (ranging from 1.5 to 3.0 units), they buy the relatively undervalued stock and sell the relatively overvalued stock. They close positions when the normalized prices next converge (or at the end of the six-month tracking interval if they do not converge). They calculate gross returns, net returns and returns in excess of the contemporaneous yield on 10-Year French and German government bonds. Using daily, weekly and monthly closing prices for the most liquid stocks listed on French and German exchanges during 1998 through 2007, they find that:
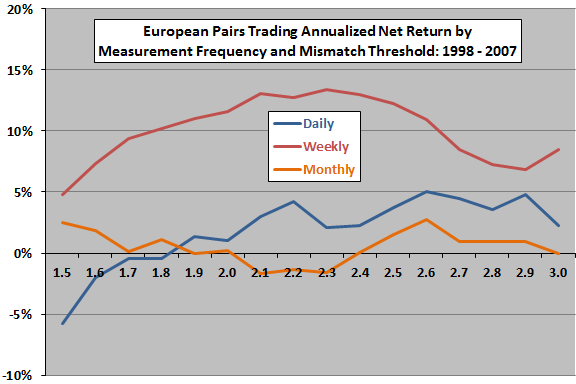
- Across price measurement frequencies, depending on the normalized price divergence threshold (see the chart below):
- Daily measurements generate average annualized gross (net) returns of 3.9% to 10.2% (-5.8% to 5.1%).
- Weekly measurements generate average annualized gross (net) returns of 7.4% to 14.8% (4.8% to 13.4%).
- Monthly measurements generate average annualized gross (net) returns of -1.2% to 3.4% (-1.6% to 2.7%).
- Trading frictions are more damaging for higher measurement frequencies and lower normalized price divergence thresholds.
- Only weekly measurements have annualized net returns in excess of the 10-year government bond yield (optimally 7.2% to 9.0% for normalized price divergence thresholds of 2 to 2.5).
- For the weekly measurement frequency, long positions are more profitable than short positions, suggesting that undervaluation is more material than overvaluation.
- Relative to the combined CAC40 and Xetra DAX indexes, the weekly measurement frequency generates positive a alpha and a beta close to zero (market neutral).
- Based on comparison to random trading simulations, pairs trading performance for daily and weekly measurement frequencies clearly involves more than luck.
The following chart, constructed from data in the paper, plots average annualized net returns from pairs trading as specified above by stock price measurement frequency (daily, weekly and monthly) and by normalized price divergence threshold (1.5 to 3.0 normalized price units) over the sample period. Results indicate that a weekly price measurement interval and moderate level of divergence works best for the specified stock universe.

In summary, evidence indicates that weekly price measurement and a moderate level of price divergence works best for pairs trading of liquid European stocks.
Cautions regarding findings include:
- The dataset, ending with 2007, is somewhat stale. It would be interesting to see whether the increase in high-frequency trading over the past few years affects findings.
- There is potential for data snooping bias in selection of the two-year pairs identification interval, the six-month pairs trading interval and the normalized price divergence threshold. Such bias inflates expected returns.
- The study does not specify the level of trading frictions used to estimate net returns. The assumed level may not be realistic for some traders.
- The study apparently ignores any costs of shorting overvalued pair members.