Can advanced regression techniques identify monthly cross-industry lead-lag return relationships that usefully indicate an industry rotation strategy? In their January 2018 paper entitled “Dynamic Return Dependencies Across Industries: A Machine Learning Approach”, David Rapach, Jack Strauss, Jun Tu and Guofu Zhou examine dynamic relationships between past and future returns (lead-lag) across 30 U.S. industries. To guard against overfitting the data, they employ a machine learning regression approach that combines a least absolute shrinkage and selection operator (LASSO) and ordinary least squares (OLS). Their approach allows each industry’s return to respond to lagged returns of all 30 industries. They assess economic value of findings via a long-short industry rotation hedge portfolio that is each month long (short) the fifth, or quintile, of industries with the highest (lowest) predicted returns for the next month based on inception-to-date monthly calculations. They consider three benchmark hedge portfolios based on: (1) historical past average returns of the industries; (2) an OLS-only approach; and, (3) a cross-sectional, or relative, momentum approach that is each month long (short) the quintile of industries with the highest (lowest) returns over the past 12 months. Using monthly returns for 30 value-weighted U.S. industry groups during 1960 through 2016, they find that:
- The LASSO-OLS approach identifies at least one lagged industry return that is a significant predictor for 28 individual industry returns, while multiple lagged industry returns are significant predictors for 20 individual industry returns. Lagged financial sector returns predict returns for many industries.
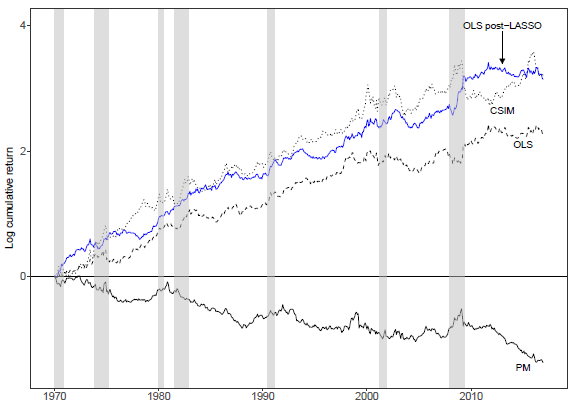
- For historical average returns, OLS-only, LASSO-OLS and relative momentum industry rotation hedge portfolios during a 1970-2016 out-of-sample test, key gross performance results are, respectively (see the chart below):
- Annualized average return: -2.3%, 5.5%, 7.3%, 8.2%.
- Annualized volatility (standard deviation or monthly returns): 10.9%, 11.6%, 11.3%, 16.6%.
- Annualized Sharpe ratio: -0.21, 0.47, 0.65, 0.50.
- Annualized Sortino ratio: -0.28, 0.77, 1.16, 0.74.
- Maximum drawdown: -75%, -29%, -26%, -51%.
- Due to negative LASSO-OLS hedge portfolio exposures to equity market and value factors, it has gross 10-factor annualized alpha 8.8% and performs particularly well during economic contractions.
The following chart, taken from the paper, compares cumulative returns on a logarithmic scale for the historical average returns (PM), OLS-only (OLS), LASSO-OLS (OLS post-LASSO) and relative momentum (CSIM) industry rotation quintile hedge portfolios during 1970 through 2016. Vertical gray bars denote NBER-dated U.S. economic contractions. The historical mean portfolio performs poorly. The OLS-only portfolio produces fairly steady gains and performs well during economic contractions. LASSO-OLS performs steadily and outperforms OLS-only during contractions, with a very large gain during the 2008-2009 contraction. Relative momentum performs fairly well and differently from LASSO-OLS, but suffers multiple sharp drawdowns.

In summary, evidence indicates that there may be exploitable dynamic monthly lead-lag return relationships among U.S. industries, consistent with gradual diffusion of information across related industries.
Cautions regarding findings include:
- As noted, performance data are gross, not net. The groups of industry stocks are essentially indexes. Accounting for costs of transforming these indexes into liquid industry funds, plus costs for monthly reformation of portfolios of funds, would reduce performance.
- There is apparently no delay between monthly industry return forecasts and monthly portfolio reformations, such that precise implementation is problematic. The corresponding author did not respond to a request for clarification of this potential issue.
- The LASSO-OLS strategy is beyond the reach of most investors, who would bear fees for delegating portfolio maintenance to an investment/fund manager.
- Testing multiple strategies on the same sample introduces data snooping bias, such that the best-performing alternative overstates expectations.
See also related research on industry rotation and sector rotation.