A subscriber asked for verification of the finding in “Is Buying Stocks at an All-Time High a Good Idea?” that it is not only a good idea, but a great one, including comparison to a moving average crossover rule. To investigate, we use the S&P 500 Index as a proxy for the U.S. stock market and test a strategy that holds SPDR S&P 500 (SPY) when the S&P 500 Index stands at an all-time high at the end of last month and otherwise holds Vanguard Long-Term Treasury Fund Investor Shares (VUSTX). We compare results to buying and holding SPY, buying and holding VUSTX, and holding SPY (VUSTX) when the S&P 500 Index is above (below) its 10-month simple moving average (SMA10) at the end of last month. We assume 0.1% switching frictions. We compute average net monthly return, standard deviation of monthly returns, net monthly Sharpe ratio (with monthly T-bill yield as the risk-free rate), net compound annual growth rate (CAGR) and maximum drawdown (MaxDD) as key strategy performance metrics. We calculate the number of switches for each scenario to indicate sensitivities to switching frictions and taxes. Using monthly closes for the S&P 500 Index, SPY and VUSTX during January 1993 (inception of SPY) through October 2019, we find that:
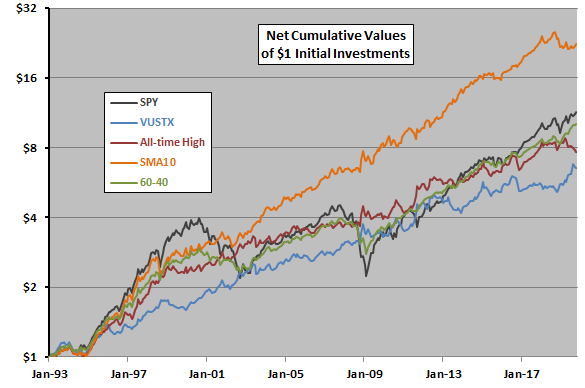
The following chart compares net cumulative values of $1 initial investments in each of:
- SPY – buy and hold SPY.
- VUSTX – buy and hold VUSTX.
- All-time High – as specified above.
- SMA10 – as specified above.
- 60-40 – each month allocates 60% to SPY and 40% to VUSTX (added after seeing results for All-time High, with monthly frictions set at 0.1% of fraction traded).
Notable findings are:
- SMA10 dominates over the full sample period.
- All-time High is somewhat like 60-40, with both smoothing the performance of SPY.
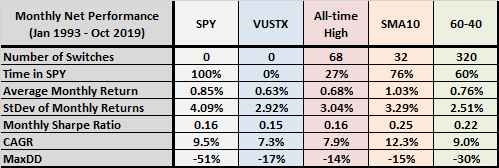
For perspective, we look at performance statistics.

The following table summarizes key net performance statistics for the same five alternatives. Results confirm the superiority of SMA10. The 320 switches for 60-40 apply only to small fractions of overall holdings. Other notable points are:
- All-time High is in SPY only 27% of the time.
- 60-40 mostly beats All-time High, except the latter has a materially shallower MaxDD.

In summary, evidence since inception of SPY does not support belief that the All-time High strategy as applied to the S&P 500 Index is a great strategy.
Cautions regarding findings include:
- Results are likely sensitive to the sample period used.
- The approach ignores delays in trading mutual funds such as VUSTX.
- The approach to modeling monthly trading frictions for 60-40 likely errs to the advantage of this strategy. However, 60-40 net performance is not very sensitive to the assumed level of trading frictions.
See also “Stock Index Returns after 52-week Highs and Lows” and “52-Week Highs for Emerging Markets Indexes”.