Are simple moving averages (SMA) effective in generating signals for short-term currency trading? In the April 2014 draft of his paper entitled “ANANTA: A Systematic Quantitative FX Trading Strategy”, Nicolas Georges investigates the effectiveness of fast (2-day) and slow (15-day) SMAs as indicators of currency exchange rate evolutions when applied to ten G10 currency pairs and aggregated. His objective is to buy (sell) currencies expected to appreciate (depreciate) based on aggregation of binary signals (see the first chart below). He rebalances the portfolio twice daily when liquidity is high at the London and New York closes. He uses market orders and includes actual trading costs unique to each currency pair, based on bid-ask spreads ranging from 0.0036% to 0.035%. He does not use stop-losses. He compiles results in U.S. dollars. Using twice daily exchange rates for G10 currency pairs during January 2003 through December 2013, he finds that:
- Over the entire sample period, the fast (2-day) SMA strategy:
- Generates an annualized net return of 7.6%, with volatility 4.2% and return-risk ratio 1.8.
- Has positive returns during 10 of 11 years.
- Bears a maximum drawdown of about 6%.
- Over the entire sample period, the slow (15-day) SMA strategy:
- Generates an annualized net return of 9.0%, with volatility 5.5% and return-risk ratio 1.6.
- Has positive returns during 11 of 11 years.
- Bears a maximum drawdown of about 6%
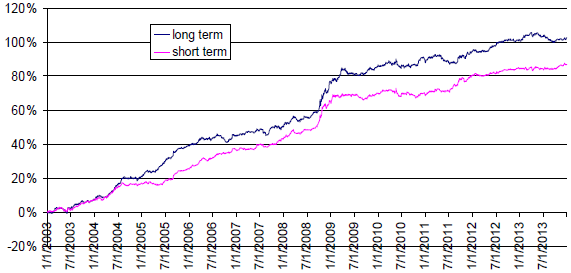
- Correlation of returns between the fast and slow alternatives is about 0.50 (see the second chart below).
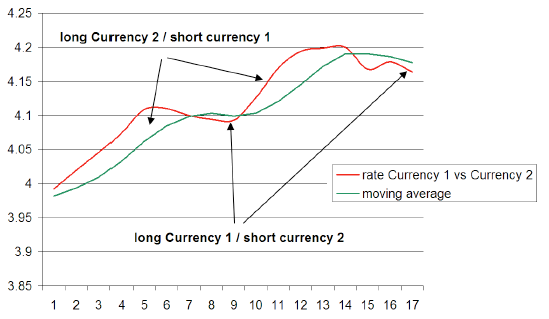
The following chart, taken from the paper, illustrates the strategy concept simplified for a single currency pair. The vertical axis is the exchange rate for Currency 1 versus Currency 2. The horizontal axis represents rebalancing points (twice daily for the above implementation). The red line tracks the exchange rate, and the green line tracks its SMA (2-day or 15-day for the above implementation). When the exchange rate crosses above (below) its SMA, the simplified strategy buys Currency 2 and sells Currency 1 (buys Currency 1 and sells Currency 2) in anticipation of a reversion to trend.
Aggregating signals across the ten G10 currency pairs to construct a diversified long-short portfolio of currencies is a much more complex process.

The next chart, also from the paper, compares net cumulative returns for fast “short-term” (2-day SMA) and slow “long-term” (15-day SMA) versions of the diversified long-short currency strategy over the entire sample period. The strategy performs particularly well during the 2008 financial crisis. The steady gain (low volatility) of the strategy suggests use of leverage.

In summary, evidence indicates that currency exchange rate SMA crossing signals are effective in identifying which currencies are likely to appreciate/depreciate at short horizons.
Cautions regarding findings include:
- Construction/execution of signals at the portfolio level is fairly complex and, if delegated, subject to management/administrative fees. Simpler strategies may be worthwhile.
- Results do not account for data acquisition/processing costs.
- While SMA interval lengths are apparently arbitrary, it is possible that they involve data snooping bias.