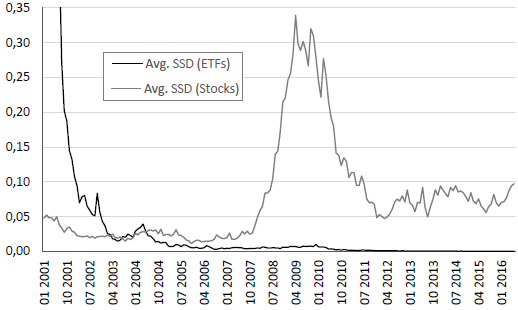
How does pairs trading of relatively diversified exchange-traded funds (ETF) compare with pairs trading of individual stocks? In his July 2016 paper entitled “Does Pairs Trading with ETFs Work?”, Philipp Doering tests a common pairs trading process on the universe of ETFs. Specifically, he:
- Each month, scales all ETF prices to $1 and computes the sum of squared price deviations (SSD) for all possible pairs over the next 12 months, excluding those with missing prices.
- Rescales prices of pairs with the lowest SSDs to $1 and, during the next six months, buys (sells) the relative loser (winner) of each of these low-SSD pairs whenever their prices diverge by more than two selection-interval standard deviations.
- Closes pair trades when prices converge, one of the ETFs discontinues trading or the end of the 6-month trading interval, whichever occurs first. Within the trading interval, selected pairs may trade more than once.
He scales returns by the number of pairs selected for trading and averages across the six overlapping pairs portfolios to compute return on committed capital. He performs this process also for individual stocks for comparison. Using daily trading data for broad samples of ETFs and stocks during January 2001 through June 2016, he finds that:
- ETF pairs track more closely than individual stock pairs. While this behavior means a smaller average loss for ETF pairs trades that do not close during the trading interval, it also means that the profitability from trades that do close during the trading interval is low (see the chart below).
- Over the full sample period, ETF (individual stock) portfolios comprised of the best 5 and best 20 pairs generate average gross monthly returns of 0.11% and 0.08% (0.26% and 0.19%), respectively. However:
- In all cases, profitability concentrates during 2007-2011.
- Both best 5 and best 20 ETF pairs portfolios have 0.03% average gross monthly returns during the last four years of the sample period.
- Matching ETFs only within an asset class generates significantly positive average returns only for equity, equity sector, equity country and bond pairs.
- Matching ETFs across asset classes mostly generates losses, including equity sector-commodity ETF pairs.
- Even though ETFs generally have low trading frictions and are easy to borrow for shorting, ETF pairs trading is likely unprofitable.
The following chart, taken from the paper, compares average SSDs during selection intervals for the 50 most closely tracking ETF pairs and the 50 mostly closely tracking stock pairs over the sample period. After the ETF universe matures (about 2006), ETF pair average SSDs become much smaller and trend to zero, confounding profitability of ETF pairs trading.

In summary, evidence indicates that ETF pairs exhibit small average absolute tracking divergences, such that ETF pairs trading is unattractive.
Cautions regarding findings include:
- Many ETFs have the purpose of diversifying stock-specific risks, indirectly working against pairs trading.
- Elevated bid-ask spreads likely accompany the high average stock pairs SSDs shown in the chart above during 2008-2009 (the financial crisis), limiting exploitation via stock pairs trading during this time.