Is it possible to determine when long-term stock market reversion is imminent? In their August 2012 paper entitled “Long-Term Return Reversal: Evidence from International Market Indices”, Mirela Malina and Graham Bornholt compare the performances of a conventional contrarian strategy that considers only long-term past returns to that of a “late-stage” contrarian strategy that buys (sells) long-term losers (winners) with relatively good (poor) recent returns, as applied to country stock market indexes. Specifically, their conventional contrarian strategy each month buys (sells) the quarter of indexes with the worst (best) returns over the past 36, 48 or 60 months and holds positions for 3, 6, 9 or 12 months (such that portfolios overlap), with a 12-month gap between ranking and holding intervals to avoid intermediate-term momentum effects. The late-stage contrarian strategy each month sorts indexes based on returns over the past 36, 48, or 60 months to identify the quarter with the worst (best) returns and then splits these winner and loser groups into halves based on returns over the past 3, 6, 9, or 12 months. The strategy then buys (sells) the long-term loser/short-term winner (long-term winner/short-term loser) indexes and holds positions for 3, 6, 9 or 12 months, with a one-month gap between ranking and holding intervals to ensure executability. Using monthly total (dividend-reinvested) returns for 18 developed and 26 emerging market indexes in U.S. dollars during January 1970 (or the earliest availability) through January 2011 (193 to 493 monthly observations across countries), they find that:
- The conventional contrarian strategy generally works. Specifically:
- For the 60-month ranking interval and the 6-month holding interval applied to developed markets, past long-term losers (winners) generate an average gross monthly return 1.31% (0.86%). Results are stronger for the 60-month than shorter ranking intervals.
- Applied to emerging markets, past long-term losers consistently outperform past long-term winners, but the differences are statistically weaker.
- The late-stage contrarian strategy is generally more profitable than the conventional contrarian strategy for both developed and emerging markets, generating an annualized risk-adjusted gross return of at least 7.3% (15.1%) when applied to developed (emerging) market indexes over the entire sample.
- Adjusting for market, size and book-to-market risk factors generally produces gross alphas larger than unadjusted gross returns, with the late-stage strategy outperforming the conventional strategy.
- However, profitability of both the conventional and late-stage contrarian strategies (long-term losers minus winners) applied to developed markets is close to zero during the second half of the sample period (January 1990 through January 2011). It appears that increased correlation of developed markets during the second half eliminates hedge profitability. The emerging markets sample, beginning in 1988, is too short for meaningful subperiod analysis.
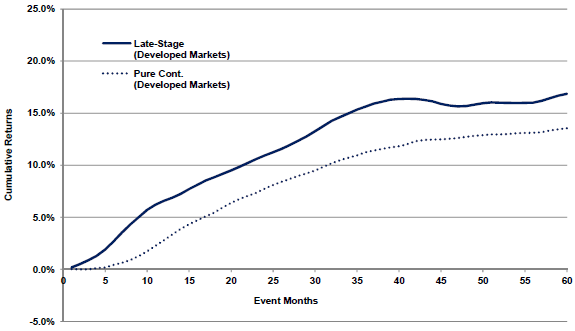
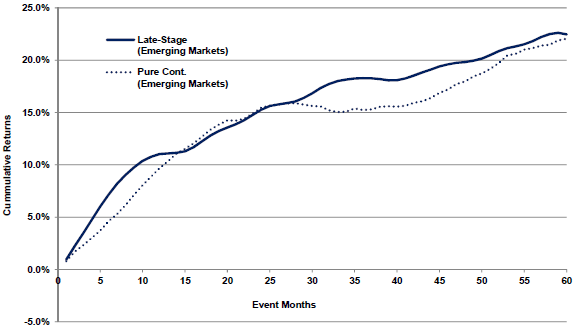
The following charts, taken from the paper, compare average gross cumulative returns of the late-stage contrarian portfolios (Late-Stage) and the conventional contrarian portfolios (Pure Cont.) reformed monthly during the 60 months after initial portfolio formation (non-overlapping portfolios). Both strategies employ 60-month long-term ranking intervals, and the late-stage strategy employs a 6-month short-term ranking interval. The upper (lower) chart applies the strategies to developed (emerging) market indexes.
Results indicate that, for both developed and emerging markets, the advantage of the late-stage strategy accrues during the six to nine months after portfolio formation. After that interval, the late-stage strategy essentially maintains its lead for developed markets but loses its lead for emerging markets.
It is arguable that the initial outperformance of the late-stage contrarian strategy relative to the conventional strategy derives from combining long-term reversion and intermediate term momentum effects.


In summary, evidence indicates that adding an intermediate-term momentum component enhances a long-term reversion strategy when applied to country stock market indexes.
Cautions regarding findings include:
- The available samples for many indexes are short in terms of number of bull-bear market cycles and number of independent ranking and holding intervals.
- The study uses gross, rather than net returns. Including reasonable trading frictions for switching indexes from one holding period to the next would reduce reported returns. Trading frictions likely vary considerably across indexes and over time with market liquidity and brokerage practices. Costs of shorting indexes would further reduce hedge strategy returns.
- The use of indexes for return calculations tends to overstate performance by ignoring the trading frictions and management fees involved in creating tradable assets from them.
- The large number of combinations of ranking intervals, holding intervals and market categories introduces data snooping bias, such that the best and worst results may substantially overstate effects.