A subscriber inquired whether “The Only Indicator You Will Ever Need” really works. This technical indicator, a form of the Coppock Guide (or curve or indicator), applied to the Dow Jones Industrial Average by Jay Kaeppel, is a multi-parameter composite based on monthly closes as follows:
- Calculate the asset’s return over the past 11 months.
- Calculate the asset’s return over the past 14 months.
- Average these two past returns.
- Each month, calculate the 10-month front-weighted moving average (WMA) of this average (multiply the most recent value by 10, the next most recent by 9, the value for the month before that by 8, etc). Then sum the products and divide by 55.
- Hold the asset (cash) if this WMA is above (below) its value three months ago.
We designate this indicator 11-14WMA3. To test 11-14WMA3 in realistic scenarios, we apply it to the entire available histories for three exchange-traded funds (ETF): SPDR S&P 500 (SPY), SPDR Dow Jones Industrial Average (DIA) and iShares Russell 2000 (IWM). We consider buy-and-hold and a conventional 10-month simple moving average timing strategy (SMA10) as benchmarks. SMA10 holds the ETF (cash) when the ETF’s most recent monthly close is above (below) its 10-month SMA. Using monthly dividend-adjusted and unadjusted closes for the ETFs from their respective inceptions through September 2019 and contemporaneous 3-month U.S. Treasury bill (T-bill) yield, we find that:
Tests assume the following:
- We use unadjusted ETF closes to calculate SMA10 and 11-14WMA3 signals, and dividend-adjusted closes to calculate returns. (Results are similar when using adjusted closes to calculate signals.)
- We can slightly anticipate signals such that associated ETF-cash switches occur at the same monthly closes.
- One-way switching frictions are 0.1% of the balance.
- When in cash, active strategies earn the T-bill yield.
- Ignore tax implications of trading.
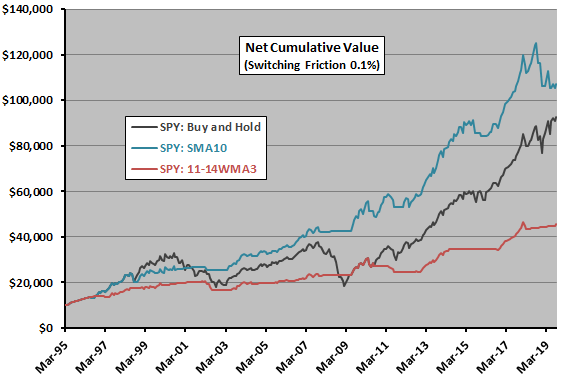
For SPY, the first available 11-14WMA3 signal is at the end of March 1995. The following chart compares net cumulative performances of $10,000 initial investments in buy-and-hold, SMA10 and 11-14WMA3 as applied to SPY from the end March 1995 through September 2019.
Applied to SPY, 11-14WMA3 suppresses volatility but substantially underperforms both buy-and-hold and SMA10.
Next, we consider DIA.

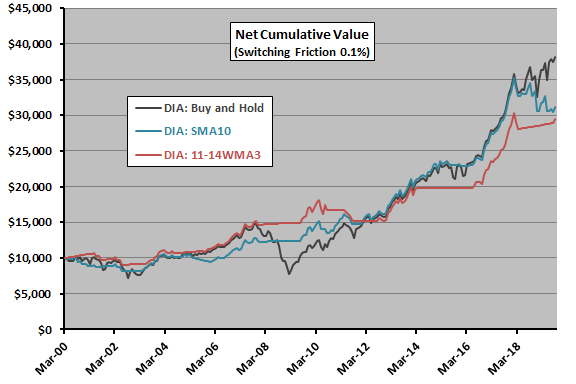
For DIA, the first available 11-14WMA3 signal is at the end of March 2000. The following chart compares net cumulative performances of $10,000 initial investments in buy-and-hold, SMA10 and 11-14WMA3 as applied to DIA from the end March 2000 through September 2019.
Applied to DIA, 11-14WMA3 eventually underperforms both buy-and-hold and SMA10.
Finally, we consider IWM.

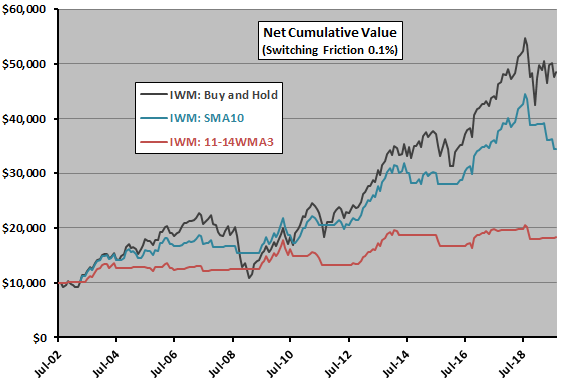
For IWM, the first available 11-14WMA3 signal is at the end of July 2002. The following chart compares net cumulative performances of $10,000 initial investments in buy-and-hold, SMA10 and 11-14WMA3 as applied to IWM from the end July 2002 through September 2019.
Applied to IWM, 11-14WMA3 substantially underperforms both buy-and-hold and SMA10.
For in-depth perspective, we include performance statistics.

The following table summarizes key net performance statistics for the above charts, including: annual Sharpe ratio for available full calendar years (with average monthly T-bill yield during a year as the risk-free rate for that year); compound annual growth rate (CAGR); and, maximum drawdown (MaxDD) based on monthly measurements.
Results generally confirm that 11-14WMA3 is competitive with benchmarks only for DIA.

In summary, evidence from tests on tradable U.S. equity index proxies over different available sample periods mostly does not support belief that the Coppock Guide as specified is a “best” (or even good) indicator.
Findings suggest that 11-14WMA3 may perform best when the sample is rich in bear markets (the DIA sample commences with a long bear market). Inclusion of the 1930s may be crucial to its reputation.
Cautions regarding findings include:
- Samples are not long in terms of number of independent 14-month measurement intervals and, especially, in terms of number of bear markets included.
- Both 11-14WMA3 and the benchmark SMA10 perform very differently for different index proxies and sample periods.
- Because it spends less than half time in equity index proxies, 11-14WMA3 may fare better when using a high-yield U.S. Treasury instrument rather than T-bills when not in stocks.
- Some investors may bear switching frictions different from the assumed level, but findings are not sensitive to the level.
- Multi-parameter indicators such as 11-14WMA3 have considerable latitude for in-sample data snooping, thereby potentially overstating out-of-sample performance by a large margin.