A subscriber asked for a performance comparison between 50% Simple Asset Class ETF Value Strategy (SACEVS) Best Value-50% Simple Asset Class ETF Momentum Strategy (SACEMS) equal-weighted top two (EW Top 2), rebalanced monthly (SACEVS-SACEMS 50-50), and the following monthly rebalanced allocations to three exchange-traded funds (3-ETF):
- 30% Vanguard Total Stock Market Index Fund (VTI).
- 30% Vanguard Total International Stock Index Fund (VXUS).
- 40% Vanguard Total Bond Market Index Fund (BND).
Using monthly returns for SACEVS-SACEMS 50-50 and month-end dividend-adjusted prices for VTI, VXUS and BND during January 2011 (limited by inception of VXUS) through January 2021, we find that:
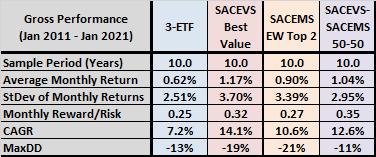
The following table summarizes full-sample (10-year) performance statistics for 3-ETF, SACEVS Best Value, SACEMS EW Top 2 and SACEVS-SACEMS 50-50. Monthly Reward/Risk is the ratio of average monthly return to standard deviation of monthly returns. Compound Annual Growth Rate (CAGR) is annualized return. Maximum Drawdown (MaxDD) is the deepest peak-to-trough loss. Notable points are:
- 3-ETF has the lowest average monthly return, but also the lowest monthly volatility. Combining these two statistics, it has the lowest monthly reward/risk.
- 3-ETF has the lowest CAGR by a material margin.
- 3-ETF has a very shallow MaxDD (second shallowest).
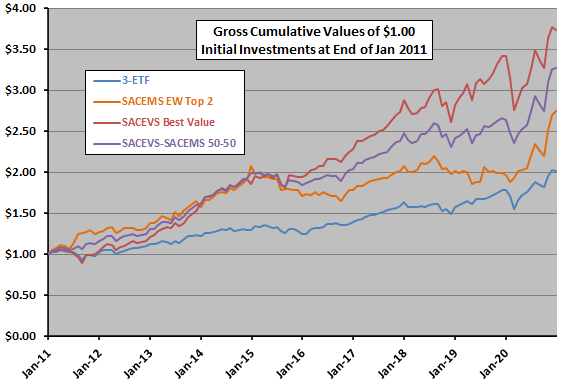
For perspective, we look at cumulative performances of these strategies.

The following chart tracks gross cumulative values of $1.00 initial investments in each strategy at the end of January 2011. 3-ETF, which is more like SACEVS Best Value than SACEMS EW Top 2, fairly persistently underperforms SACEVS Best Value (but is less volatile).

In summary, investors with low short-term and long-term risk tolerance may find 3-ETF a reasonably attractive approach (sacrificing return for low monthly volatility and shallow drawdowns).
Cautions regarding findings include:
- Performance data are gross, not net. Accounting for portfolio reformation/rebalancing costs would reduce all returns. These costs are likely similar for competing portfolios.
- The available sample period (just 10 years) is very short for reliable inference about future performance.