A subscriber asked for a comparison of two 50%-50% monthly rebalanced combinations of Simple Asset Class ETF Value Strategy (SACEVS) and Simple Asset Class ETF Momentum Strategy (SACEMS) portfolios, as follows:
- 50-50 Best Value + EW Top 2: SACEVS Best Value plus SACEMS EW Top 2, employing a somewhat more aggressive momentum portfolio.
- 50-50 Best Value + EW Top 3: Best Value plus SACEMS equal-weighted (EW) Top 3, as tracked at “Combined Value-Momentum Strategy (SACEVS-SACEMS)”.
To investigate, we run the two combinations and compare cumulative performances and annual performance statistics. Using monthly SACEVS Best Value and SACEMS EW Top 2 and EW Top 3 portfolio returns commencing July 2006 (limited by SACEMS), we find that:
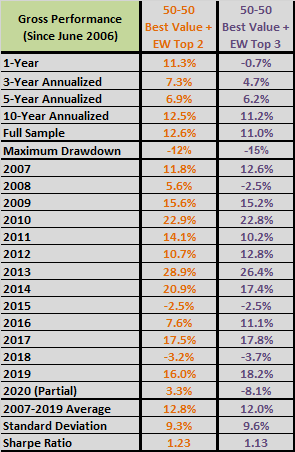
The following table summarizes gross annual performance statistics for the two portfolio combinations specified above. Annualized returns are compound annual growth rates (CAGR). The combination using SACEMS EW Top 2:
- Has higher CAGRs at all horizons.
- Has a slightly shallower maximum drawdown.
- Has a modestly high annual Sharpe ratio (using average monthly 3-month U.S. Treasury bill yield during a year as the risk-free rate for that year). SACEVS Best Value and SACEMS EW Top 2 work well together to suppress annual volatility.
The correlation of monthly returns between SACEVS Best Value and SACEMS EW Top 2 is 0.25, compared to 0.39 between SACEVS Best Value and SACEMS EW Top 3, confirming that SACEMS EW Top 2 is the better diversifier for SACEVS Best Value.
For perspective, we look at cumulative performances.

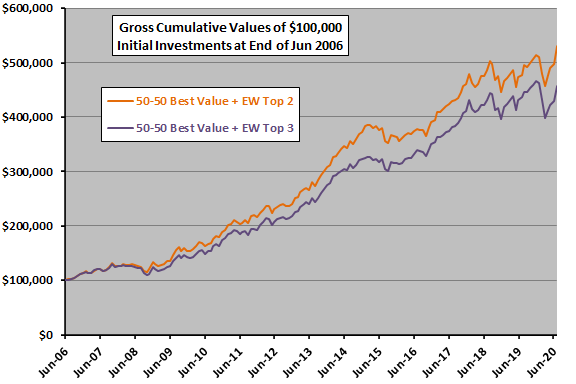
The following chart tracks gross cumulative values of $100,000 initial investments at the end of June 2006 in each of the two portfolio combinations specified above. Results indicate that outperformance of 50-50 Best Value + EW Top 2 is reasonably consistent.

In summary, available evidence offers some support for preferring SACEVS Best Value plus SACEMS EW Top 2 over SACEVS Best Value plus SACEMS EW Top 3.
Cautions regarding findings include:
- Cautions for SACEMS and SACEVS apply.
- In general, the available sample is short for reliable discrimination of different portfolio combinations.
- In particular, the substantial differences in performance among SACEMS Top 1, EW Top 2 and EW Top 3 suggest a material role for randomness (luck) for EW Top 2. This caution does not mean that EW Top 2 is a bad choice, only that the backtest likely overstates its performance relative to Top 1 and EW Top 3.