Does equity factor portfolio reformation (rebalancing) schedule materially affect portfolio performance? In their February 2020 paper entitled “Rebalance Timing Luck: The (Dumb) Luck of Smart Beta”, Corey Hoffstein, Nathan Faber and Steven Braun measure rebalance timing luck (RTL) in returns for long-only portfolios of S&P 500 stocks selected based on:
- Value – trailing 12-month earnings yield.
- Quality – average of rankings for return on equity, accruals ratio (reverse ranking) and leverage ratio (reverse ranking).
- Momentum – return from 12 months ago to one month ago.
- Low Volatility – 12-month realized volatility.
They quantify RTL as dispersion in portfolio performance (best minus worst) across different reformation schedules. They also vary number of stocks (50 to 400) and portfolio reformation frequency (annual, semi-annual or quarterly) to assess RTL sensitivity to these parameters. For corroboration, they measure RTL for replications of existing S&P Dow Jones Enhanced Value, Quality, Momentum and Low Volatility indexes. Using data for S&P 500 stocks starting July 2000 and for factor-based indexes starting January 2001, all through September 2019, they find that:
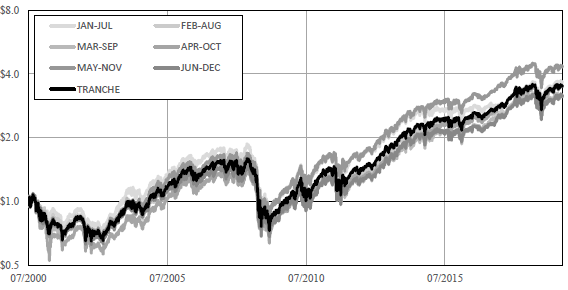
- For long-only factor portfolios, RTLs often exceeds 1% annualized (see the chart below). This luck tends to decrease with number of holdings, increase with reformation frequency and increase with inherent strategy turnover.
- No reformation schedule significantly outperforms other schedules. In other words, there is not a reformation schedule that is fundamentally superior.
- For the S&P Dow Jones index replications, full-sample annualized RTLs range from 0.25% for Low Volatility to 1.92% for Momentum. Maximum annual RTLs range from 2.9% for Low Volatility to 41.7% for Enhanced Value.
The following chart, taken from the paper, compares cumulative values of $1 initial investments in 100-stock momentum portfolios constructed from the S&P 500 universe with six different semiannual reformation schedules. The Tranche portfolio is an average for the six rebalance schedules. Results show uncertainty in outcome based on reformation schedule. While the May-November schedule has the highest cumulative return, outperformance is not statistically significant.

In summary, evidence indicates that robustness testing of factor-based strategies should include assessment of rebalance timing luck.
Cautions regarding findings include:
- Test results are gross, not net. RTL may also affect portfolio turnover and associated frictions.
- Using a tranche approach to suppress RTL entails greater execution effort and additional reformation frictions to rebalance tranche components.
See also: