What is the best way to tackle multi-class, multi-factor investing? In their August 2017 paper entitled “Investing in a Multi-Asset Multi-Factor World”, Alexandar Cherkezov, Harald Lohre, Sergey Protchenko and Jay Raol investigate the use of factor investing across multiple asset classes. They define several factors for each of four asset classes, as follows:
- Equities (individual stocks for developed and emerging markets) – value, momentum, quality and low volatility.
- Currencies (forwards for developed and emerging markets) – carry, value, momentum and quality.
- Commodities (24 futures series) – carry, term (duration) and momentum.
- Interest rates (10-year swaps for developed and emerging markets) – carry, value, momentum and quality.
To integrate the portfolio with high diversification, they employ diversified risk parity by each month: (1) identifying uncorrelated clusters of risk across asset classes and factors based on a rolling 60-month or expanding (inception-to-date) lookback window; and, (2) setting long-only allocations such that each uncorrelated risk cluster contributes equally to overall portfolio risk. For comparison, they also consider equal weight, minimum variance and equal risk contribution (equal contribution to portfolio risk by each individual factor) allocation approaches. Using data needed to form factor portfolios and measure factor returns in U.S. dollars across asset classes from the end of January 2001 through the end of December 2016, they find that:
- Mean-variance analysis suggests that exploiting factors for all asset classes helps to shift a portfolio toward higher returns with lower volatilities (but only very slightly for interest rate factors).
- On average, the long-only diversified risk parity portfolio has an 8.5% allocation to equities and a 17.6% allocation to government bonds.
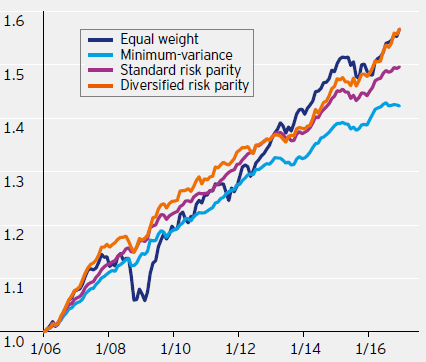
- Over the full sample period, based on a 60-month rolling window to compute monthly portfolio allocation parameters (see the chart below):
- The optimal (long-only) diversified risk parity portfolio has gross annual return 4.6% (4.2%) and annual volatility 2.2% (2.0%), with gross annual Sharpe ratio 1.6 (1.6) and maximum drawdown -2.0% (-2.6%). The long-only constraint has little effect on performance.
- A conventional 60-40 equities-government bonds portfolio has gross annual return 4.4% and annual volatility 9.0%, with gross annual Sharpe ratio 0.4 and maximum drawdown -34%.
- An equally weighted portfolio has gross annual return 4.2% and annual volatility 3.4%, with gross annual Sharpe ratio 0.9 and maximum drawdown -7.7%.
- The minimum variance portfolio has gross annual return 3.3% and annual volatility 1.3%, with gross annual Sharpe ratio 1.7 and maximum drawdown -1.2%.
- The equal risk contribution portfolio has gross annual return 3.8% and annual volatility 1.4%, with gross annual Sharpe ratio 2.0 and maximum drawdown -1.5%.
The following chart, taken from the paper, tracks gross performances of the above four approaches to multi-class, multi-factor portfolio diversification as described above based on a 60-month rolling window to compute monthly portfolio allocation parameters. Notable points are:
- Equal weight performs reasonably well, except for the drawdown during the 2008-2009 financial crisis.
- Minimum variance lags, especially during the last five years of the sample period.
- Diversified risk parity often leads and is relatively consistent, reflecting risk taken in a balanced fashion.

In summary, evidence suggests that diversified risk parity applied to a multi-class, multi-factor universe of return streams offers attractively smooth gross investment performance.
Cautions regarding findings include:
- The sample period (2001-2016) and test period (2006-2016) are not long in terms of market/factor performance cycles.
- While the authors state that factor returns account for costs and are investable, they do not address costs of monthly reformation of multi-class, multi-factor portfolios. These costs would reduce returns of those portfolios.
- The approach described is at multiple levels beyond the reach of most investors, who would bear fees for delegating to a fund manager.
- Testing multiple strategies on the same data introduces snooping bias, such that the best-performing strategy overstates expectations (is somewhat lucky for the sample).