Why do optimal portfolios derived from Modern Portfolio Theory (MPT) often lose to simple equal-weight portfolios? In the March 2013 version of their paper entitled “Why Optimal Diversification Cannot Outperform Naive Diversification: Evidence from Tail Risk Exposure”, Stephen Brown, Inchang Hwang and Francis In explore why mean-variance optimal diversification (giving more weight to those assets driving mean-variance efficiency) do not outperform naive diversification (equal-weight). They consider portfolios formed from each of two sets of assets: (1) factor-based sorts of U.S. stocks (effectively equity style indexes); and, (2) individual U.S. stocks. Unlike prior research, they focus on return distribution tail exposures of test portfolios rather than errors in forecasts of mean returns and return covariances for assets used to construct optimal portfolios. They rebalance competing portfolios monthly. For mean-variance optimization, they use a 10-year rolling history to forecast required parameters. They evaluate both long-short and long-only mean-variance optimal portfolios. Using monthly returns for 20 factor-based U.S. stock sorts from Ken French’s library and for a broad sample of individual U.S. stocks during January 1963 through December 2011 (588 months), they find that:
- Equal-weight portfolios consistently outperform mean-variance optimal portfolios. Specifically, compared to long-short and long-only optimal portfolios, equal-weight portfolios generally have:
- Sharpe ratios, certainty equivalent returns and manipulation-proof performance measures just as high or higher.
- Much lower turnover.
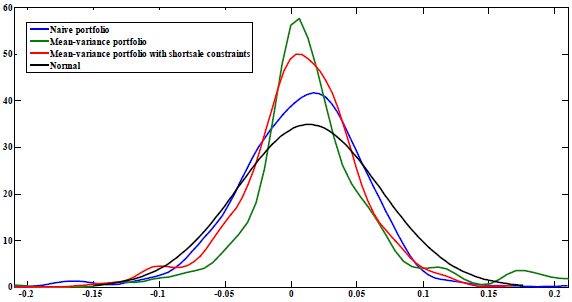
- Equal-weight return distributions exhibit properties (such as negative skewness and positive excess kurtosis) that result in higher exposure to the downside tail and lower exposure to the upside tail than the value-weighted market portfolio (see the chart below). These effects increase with the number of assets in the portfolio.
- Results imply that equal weighting beats optimal diversification as compensation for higher downside and lower upside potentials.
The following chart, taken from the paper, compares return distributions for equal-weight, long-short mean-variance optimal and long-only mean-variance optimal (“with shortsale constraints”) portfolios reformed monthly from 20 factor-based U.S. stock sorts as described above. These sorts are effectively equity style indexes. For further comparison, it also shows the normal distribution corresponding to the mean and standard deviation of the pooled return distributions of these three portfolios.
All three portfolios exhibit positive excess kurtosis (fat tails) compared to the normal distribution. The two portfolios exhibiting negative skew (larger, longer left tails than the normal distribution), equal-weight and long-only mean-variance optimal, tend to outperform long-short mean-variance optimal. Negative skewness is more pronounced for equal-weight than long-only mean-variance optimal. Results suggest outperformance is compensation for high exposure to the left tail and low exposure to the right tail.
Results based on portfolios of individual stocks are similar but more pronounced.

In summary, evidence indicates that equal-weight diversification beats mean-variance optimal diversification as compensation for increased left tail risk and reduced upside potential.
Cautions regarding findings include:
- Portfolio returns are gross, not net. Including reasonable trading frictions and shorting costs, which vary considerably over the sample period, would reduce reported returns. Because of higher turnovers, including trading frictions would reduce returns for mean-variance optimal portfolios more than equal-weight portfolios.
- Moreover, returns for portfolios comprised of 20 factor-based stock sorts do not account for costs of monthly turnover for these sorts.
- Shorting as specified by the long-short mean-variance optimal portfolio may not be feasible.