Are target‐date (glidepath) funds that periodically decrease (increase) allocation to stocks (bonds and cash) as the investor ages competitive with alternative strategies? In his February 2013 paper entitled “The Glidepath Illusion: An International Perspective”, Javier Estrada evaluates three alternative types of strategies, all based on a working life of 40 years with annual retirement fund contributions of $1,000 (inflation‐adjusted for a cumulative contribution of $40,000 in real terms):
- Lifecycle strategies with initial stock-bond allocations (in percent) of 100‐0, 90‐10, 80‐20, 70‐30 and 60‐40, and respective final allocations of 0-100, 10‐90, 20‐80, 30‐70 and 40‐60. Allocation adjustments are annual on linear glidepaths.
- Mirror image strategies that start with 0-100, 10‐90, 20‐80, 30‐70 and 40‐60 allocations and end with 100‐0, 90‐10, 80‐20, 70‐30 and 60‐40 allocations.
- Five alternative strategies: fully invested in stocks throughout the 40‐year working life (100×40); fully invested in stocks for the first 20 or 30 years, then shifting annually and linearly out of stocks and into bonds for the remaining 20 or 10 years to end with a 50‐50 stock‐bond allocation (100×20 or 100×30); and, a constant stock-bond allocation of 50‐50 or 60‐40 over 40 years, rebalanced annually.
For each of the World, Europe and 19 developed countries, he generates terminal wealth statistics for 71 overlapping 40-year intervals, the first spanning 1900-1939 and the last spanning 1970-2009. Using real total returns for individual countries (in local currencies adjusted by local inflation) and for the World and Europe (in dollars adjusted by U.S. inflation) during 1900 through 2009, he finds that:
- In general, lifecycle strategies generate lower mean, median and maximum terminal wealth than either their mirror images or the alternative strategies over the sample period.
- While the lifecycle strategies are generally less volatile than the mirror image and alternative strategies, the lifecycle strategies generally produce lower minimum terminal wealth over the sample period.
- In other words, cumulative outperformance of the mirror image and alternative strategies compared to the lifecycle strategies tend to override bad luck over a working lifetime.
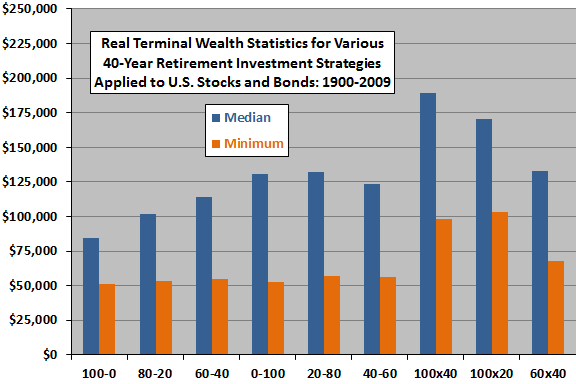
The following chart, constructed from data in the paper, summarizes median and minimum real terminal wealth for three lifecycle strategies, three mirror image strategies and three alternative strategies (all as defined above) applied to U.S. stocks and U.S. Treasury bonds over 40-year intervals during 1900 through 2009. Lifecycle strategies generate lower median terminal wealth and similar or lower minimum terminal wealth than the mirror image and alternative strategies.
The most attractive strategy is 100% investment in stocks for all, or much of the early part, of a 40-year working life.

In summary, evidence suggests that lifecycle funds tend to generate lower expected and potential terminal values, without elevating minimum terminal values, compared to their mirror images and to other alternative lifetime stock-bond allocation strategies.
Cautions regarding findings include:
- The study uses returns for indexes rather than tradable assets. Including the costs of creating and maintaining funds as proxies for these indexes would reduce returns.
- Terminal wealth calculations are gross, not net. Including trading frictions associated with annual rebalancing would reduce reported results. In this study, the best-performing strategies have the lowest such trading frictions.
- Use of overlapping measurement intervals overstates sample size and can distort statistics. There are fewer than three independent 40-year intervals in the overall sample, which may not be representative of 40-year intervals over longer periods.
- Results may be sensitive to retirement fund contribution assumptions.
For related research, see “Achilles’ Heel of Pre-determined Lifecycle Funds?” and “Leverage Stock Investments While Young?”.