In response to “Review of Dual Momentum with Just Three Assets”, a subscriber suggested adding gold in competition with long-term U.S. Treasury bonds as a safe haven from equities. To test this potential enhancement of Accelerating Dual Momentum (ADM), we each month:
- Calculate for each of SPDR S&P 500 (SPY), iShares MSCI EAFE Small-Cap ETF (SCZ), iShares 20+ Year Treasury Bond (TLT) and SPDR Gold Shares (GLD) the sum of its 1-month, 3-month and 6-month past returns.
- If sums for both SPY and SCZ are negative, buy the one of TLT and GLD with the higher sum.
- If both sums for SPY and SCZ are not negative, buy the one with the higher sum.
Using end-of-month dividend-adjusted prices of these ETFs during December 2007 (limited by SCZ) through April 2020, we find that:
Calculations assume:
- Use total returns (including dividends) when calculating past returns.
- It is possible to determine next-month positions just before monthly closes and execute any asset switches at the same monthly closes.
- Ignore switching frictions and tax implications of trading.
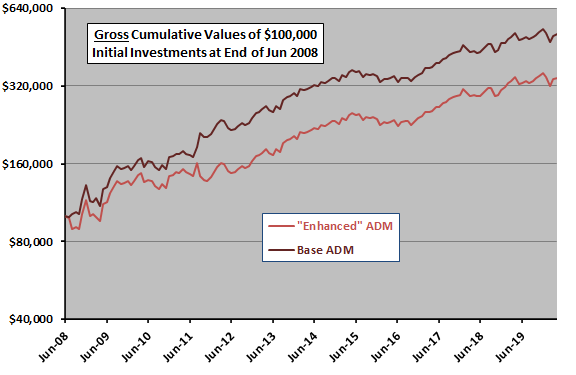
The following chart compares on a logarithmic scale cumulative performances of ADM with GLD (“Enhanced”) and without GLD (Base) as an additional safe haven choice. ADM Base is the clear winner, with outperformance concentrating in the first three to four years of the sample period.
For additional perspective, we look at detailed monthly and annual performance statistics.
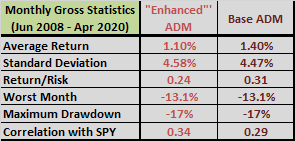
The following table summarizes monthly gross performance statistics for “Enhanced” ADM and Base ADM over the full sample period, including: average monthly return, standard deviation of monthly returns, reward-to-risk ratio (average monthly return divided by standard deviation of monthly returns), worst monthly return, maximum drawdown based on monthly returns and correlation of monthly returns with SPY. From this perspective, Base ADM is generally more attractive.
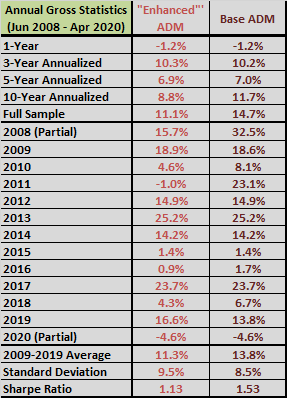
The next table summarizes annual gross performance statistics for “Enhanced” ADM and Based ADM over the full sample period. The annualized returns are compound annual growth rates (CAGR). For Sharpe ratio, to calculate excess annual return, we use average monthly yield on 3-month Treasury bills during a year as the risk-free rate for that year. Results mostly confirm attractiveness of Base ADM compared to “Enhanced” ADM. A sample period of 11 years is short for analysis of annual statistics.
As before, we also conduct a longer test using mutual funds.
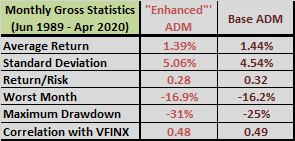
The following tables summarize monthly gross performance statistics (upper table) and annual gross performance statistics (lower table) for “Enhanced” ADM and Base ADM as executed with four mutual funds:
- Vanguard 500 Index Fund Investor Shares (VFINX) to represent U.S. stocks.
- T. Rowe Price International Discovery Fund (PRIDX) to represent international small stocks.
- Vanguard Long-term Treasury Fund Investor Shares (VUSTX) to represent long-term U.S. Treasury bonds.
- Fidelity Select Gold Portfolio (FSAGX) to represent gold.
Using end-of-month dividend-adjusted prices of these funds during December 1988 (limited by PRIDX) through April 2020, we find that Base ADM outperforms “Enhanced” ADM, though not by as wide a margin as above.
Note that execution of ADM with mutual funds as modeled is problematic due to: (1) delay in availability of closing prices; (2) mutual fund loads that may reduce returns during parts or all of the sample period; and, (3) restrictions on/penalties for frequent fund trading during parts or all of the sample period.
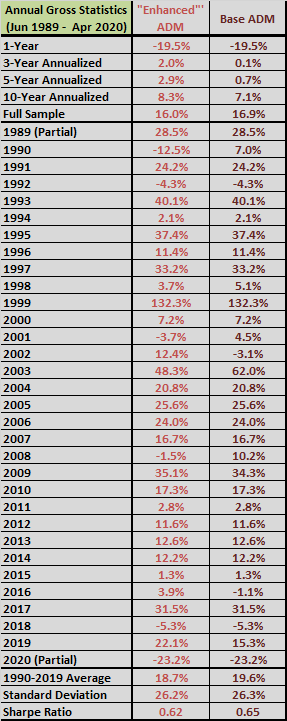
In summary, evidence does not support belief that adding gold as an alternative safe haven to ADM improves performance.
Cautions regarding findings include:
- As noted, performance data are gross, not net. ADM asset switching frictions, though not large, would lower performance.
- There may be data snooping bias in the choice of international small stocks as the alternative to the U.S. stock market. There may also be data snooping bias in the specified (somewhat non-intuitive) combination of lookback intervals.
- PRIDX may not be a good proxy for the overall universe of international small stocks.
- The sample period is one of mostly declining interest rates and rising bond prices. Results during a bond bear market may differ.