How should investors manage their portfolios to withstand market crashes. In his March 2019 paper entitled “Managing the Downside of Active and Passive Strategies: Convexity and Fragilities”, Raphael Douady discusses how to construct an “antifragile” portfolio given that most equity market risk is not readily observable. He describes ways to monitor the probability of a new crisis. Based on in-depth analysis of market behaviors during past speculative bubbles and other crises, he concludes that:
- The Black-Litterman model of asset allocation, widely used by institutions, is based on mean-variance analysis but exposed to persistent effects of regime changes and Black Swans.
- Any simple automated approach for creating portfolio “convexity” (higher response to market upside than to market downside) to mitigate exposure to Black Swans: (1) bears an insurance premium (such as buying put options); and, (2) introduces exposures to other Black Swans.
- The best way to anticipate crises (even small ones) and generate risk mitigation approaches is to use different models that focus on extreme correlations during the most volatile times.
- Anticipation of crises means avoiding investment approaches based on simple mechanical responses to historical data, because such approaches tend to induce unfavorable market adaptations.
- Among non-financial events in recent years, only the 9/11 terrorist attack, the Kobe earthquake and the Fukushima nuclear plant accident visibly affected markets. All other crises were collapses of houses of cards.
- Speculative bubbles involve disordered (low-correlation) rises and, upon bursting, several high-correlation corrections interspersed with bounces.
- Credit bubble (driven by company leverage) return distributions have fat left tails after bursting but not fat right tails before bursting, like a put-selling strategy that steadily collects small gains but occasionally has big losses.
- Leading up to crises:
- Upside reactions to market action become less correlated and downside reactions become quicker, stronger and more correlated.
- Asset returns oscillate more rapidly than usual between high and low volatility (and high and low correlations), with increased frequency of mid-size fat-tail events.
- Enhanced correlations between risk factors increase the number of important factors and thereby the number of extreme scenarios.
- From a purely statistical perspective, pre-crisis regimes are difficult to distinguish from sustainable calm. Machine learning methods are helpful.
- Crash risk mitigations include:
- Buying protective options (with a drag on portfolio performance).
- Using the Kelly criterion for position sizing to create convexity in responses to the market.
- Adopting strategies that have naturally convex responses to the market, such as trend following/momentum, high-dividend stocks and convertible bonds, especially in combination with a low-risk investment such as cash.
- Strategy optimization inherently induces calibration error with a concave (higher downside than upside sensitivity) market response. Allowing ranges of values for model parameters mitigates this tendency, but this kind of fragility derives from market regime changes that change calibration.
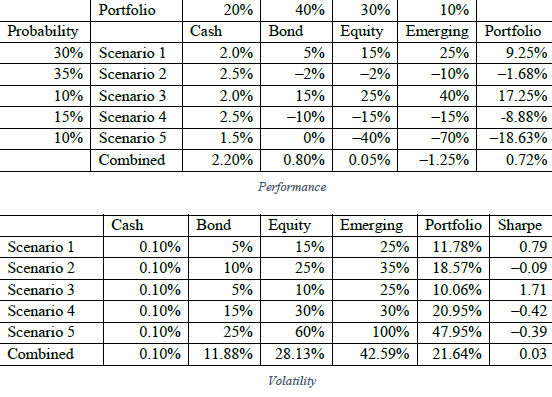
- The five most probable scenarios for 2019, taken together, indicate an unattractive investment environment (see the tables below).
The following tables, taken from the paper, map the following five market/economic scenarios for 2019, with scenario probabilities assigned by the author, into asset class and overall portfolio returns (upper table) and volatilities (lower table) The combined portfolio represents a conservative 60% fixed income-40% equities mix as specified in the top row of the upper table.
- Optimistic (30% probability).
- Sequence of limited corrections with intervening bounces that gradually lower currently high price-earnings-ratios (35% probability).
- Super-optimistic (10% probability).
- Sequence of more severe corrections and no intervening bounces (15% probability).
- Catastrophe similar to 2008 (10% probability).

In summary, avoiding the full impact of market crashes involves the difficult task of anticipating market regimes by: (1) monitoring market responses to advances and declines, and (2) maintaining a portfolio with commensurately greater upside than downside sensitivity to the market.
Cautions regarding conclusions include:
- The paper describes, but does not demonstrate concrete implementation of, concepts for maintaining an antifragile portfolio.
- While asserting that the benefits of concepts and methods described are material, the paper does not quantify them.
- The market regime monitoring methods described are beyond the reach of most investors, who would bear fees for delegating the work to an advisor.